OPEN-SOURCE SCRIPT
Aggiornato FTFC (The Strat)
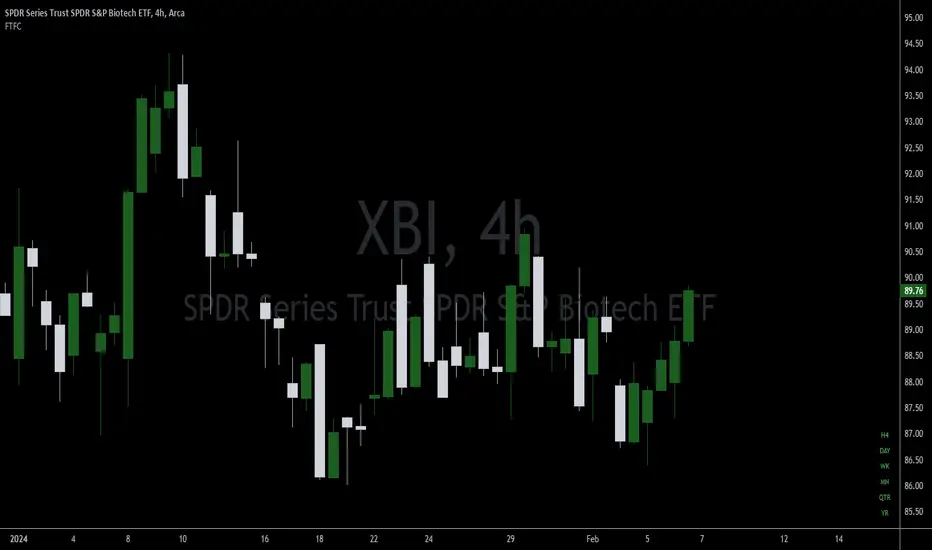
This indicator provides the status (red="down/short", green="up/long") of the current and higher timeframes in conjunction with The Strat, created by Rob Smith. In The Strat, Rob states that one should trade in the direction of timeframe continuity. What this means is if the majority of higher time frames are trading to the upside, one should only take long positions on the current timeframe. The more timeframes trading in the same direction increases the likelihood that a trade will work out in the trader's favor. The purpose of this indicator is to provide a visual cue as to when the current symbol has reached Full Timeframe Continuity (FTFC). For example, M5, M15, M30, H1 all green, only take long trades on the M5 time frame.
Note di rilascio
Added Quarterly and Yearly identifiers.Note di rilascio
Fixed an issue where Month and Week were not displaying correctly unless the chart was on that specific timeframe.Script open-source
Nello spirito di TradingView, l'autore di questo script lo ha reso open source, in modo che i trader possano esaminarne e verificarne la funzionalità. Complimenti all'autore! Sebbene sia possibile utilizzarlo gratuitamente, ricordiamo che la ripubblicazione del codice è soggetta al nostro Regolamento.
Declinazione di responsabilità
Le informazioni e le pubblicazioni non sono intese come, e non costituiscono, consulenza o raccomandazioni finanziarie, di investimento, di trading o di altro tipo fornite o approvate da TradingView. Per ulteriori informazioni, consultare i Termini di utilizzo.
Script open-source
Nello spirito di TradingView, l'autore di questo script lo ha reso open source, in modo che i trader possano esaminarne e verificarne la funzionalità. Complimenti all'autore! Sebbene sia possibile utilizzarlo gratuitamente, ricordiamo che la ripubblicazione del codice è soggetta al nostro Regolamento.
Declinazione di responsabilità
Le informazioni e le pubblicazioni non sono intese come, e non costituiscono, consulenza o raccomandazioni finanziarie, di investimento, di trading o di altro tipo fornite o approvate da TradingView. Per ulteriori informazioni, consultare i Termini di utilizzo.