OPEN-SOURCE SCRIPT
Aggiornato Key Prices & Levels
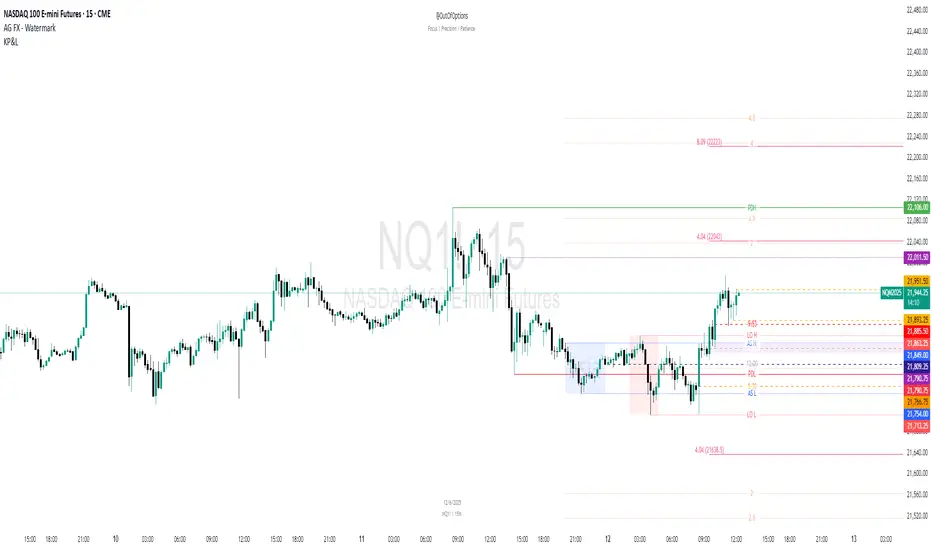
This indicator is designed to visualize key price levels & areas for NY trading sessions based on the price action from previous day, pre-market activity and key areas from NY session itself. The purpose is to unify all key levels into a single indicator, while allowing a user to control which levels they want to visualize and how.
The indicator identifies the following:
Configurability:
How is it different:
Identifies novel concepts such as 9:53 open, root candle that can be used as a bounce/resistance area during AM/PM sessions as well as confirmation of direction once closed over/under to indicate price's willingness to continue moving in the same direction.
It also shows 1st 1m FVG after New York Session open, that can be used to determine direction of the price action depending on PA's reaction to that area. While both 9:53 and 1m FVG are 1m based markers, these levels are visualized by the indicator on all timeframes from 15s to 1h.
Additionally the indicator is able to both highlight key prices in the price scale pane as well as combine labels to minimize clutter when multiple levels have the same price.
Lastly for in-session ranges such as Lunch High/Low the indicator updates the range in real-time as opposed to waiting for the lunch session to be over.
The indicator identifies the following:
- Asia Range High/Lows, along with ability to visualize with a box
- London Range High/Lows, along with ability to visualize with a box
- Previous Day PM Session High/Lows
- Current Day Lunch Session High/Lows, starts appearing after 12pm EST once the lunch session starts
- New York Open (8:30am EST) price
- 9:53 Open (root candle) price
- New York Midnight (12:00am EST) price
- Previous Day High/Lows
- First 1m FVG after NY Session Start (after 9:30am), with the ability to configure minimum FVG size.
- Opening Range Gap, showing regular market hours close price (previous day 16:15pm EST close), new session open price (9:30am EST open) and optionally the mid-point between the two
- Asia Range 50% along with 2, 2.5, 4 and 4.5 deviations of the Asia range in both directions
Configurability:
- Each price level can be turned off
- Styles in terms of line type, color
- Ability to turn on/off labels for price levels and highlighting of prices on price scale
- Ability to control label text for price levels
How is it different:
Identifies novel concepts such as 9:53 open, root candle that can be used as a bounce/resistance area during AM/PM sessions as well as confirmation of direction once closed over/under to indicate price's willingness to continue moving in the same direction.
It also shows 1st 1m FVG after New York Session open, that can be used to determine direction of the price action depending on PA's reaction to that area. While both 9:53 and 1m FVG are 1m based markers, these levels are visualized by the indicator on all timeframes from 15s to 1h.
Additionally the indicator is able to both highlight key prices in the price scale pane as well as combine labels to minimize clutter when multiple levels have the same price.
Lastly for in-session ranges such as Lunch High/Low the indicator updates the range in real-time as opposed to waiting for the lunch session to be over.
Note di rilascio
Added the ability to show 9:30 30s candle deviationsNote di rilascio
Allow 9:30 open deviations to work on time-frames up-to 5mUnify code for obtaining prices on different time-frames
Note di rilascio
Fixed a bug with version conflictsNote di rilascio
Optimize codeAllow 30s opening range deviations to work on higher timeframes
Note di rilascio
Fix bug with 30s range on hourly timeframePrevent 30s range error on historical data
Note di rilascio
Fixed a bug that can cause 1m to display wrong midnight open priceNote di rilascio
Added an option to control the label text size and the width of the linesEnsure 30s deviations are not shown on time-frames >=1 hours, previously was showing up with incorrect values on time-frames greater than 1hr
Note di rilascio
Small bug fixesNote di rilascio
- Added ability to disable Midnight, 9:53 open and New York Open (8:30) levels
- Added option to make label text bold
- Added option to override all label colors to a color of your choice
Note di rilascio
Update ChartNote di rilascio
Fixed a small bug that prevent 30s Deviations from being disabled, this should in theory also fix issues for users without access to seconds timeframesNote di rilascio
Fixes for folks without access to seconds chartNote di rilascio
Added support for showing previous day 50%Note di rilascio
Fixed midnight level between market open at 6pm and midnightNote di rilascio
Added a new setting to display -6 opening range deviation, which can be a retrace spotScript open-source
Nello spirito di TradingView, l'autore di questo script lo ha reso open source, in modo che i trader possano esaminarne e verificarne la funzionalità. Complimenti all'autore! Sebbene sia possibile utilizzarlo gratuitamente, ricordiamo che la ripubblicazione del codice è soggetta al nostro Regolamento.
Declinazione di responsabilità
Le informazioni e le pubblicazioni non sono intese come, e non costituiscono, consulenza o raccomandazioni finanziarie, di investimento, di trading o di altro tipo fornite o approvate da TradingView. Per ulteriori informazioni, consultare i Termini di utilizzo.
Script open-source
Nello spirito di TradingView, l'autore di questo script lo ha reso open source, in modo che i trader possano esaminarne e verificarne la funzionalità. Complimenti all'autore! Sebbene sia possibile utilizzarlo gratuitamente, ricordiamo che la ripubblicazione del codice è soggetta al nostro Regolamento.
Declinazione di responsabilità
Le informazioni e le pubblicazioni non sono intese come, e non costituiscono, consulenza o raccomandazioni finanziarie, di investimento, di trading o di altro tipo fornite o approvate da TradingView. Per ulteriori informazioni, consultare i Termini di utilizzo.