OPEN-SOURCE SCRIPT
Hypothesis TF Strategy Evaluation
This script provides a statistical evaluation framework for trend-following strategies by examining whether mean returns (measured here as 1-period Rate of Change, ROC) differ significantly across different price quantile groups.
Specifically, it:
Key Features
Important Notes
Usage Suggestions
Example
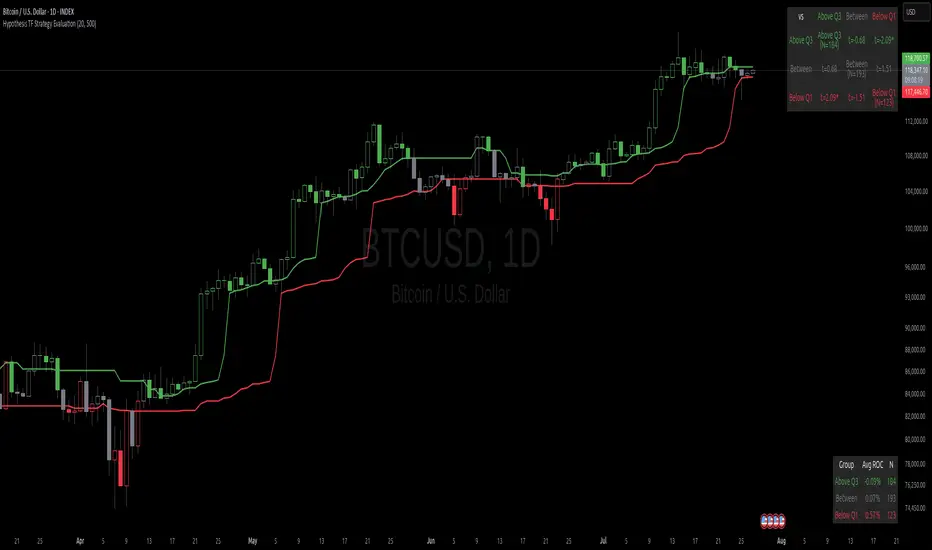
In this example, the script was run with a quantile length of 20 bars and a lookback of 500 bars for ROC classification.
We consider a simple hypothetical "strategy":
The screenshot below demonstrates the results of this evaluation. Surprisingly, the "long" group shows a negative average return, while the "short" group has a positive average return, indicating mean reversion rather than trend following.

The hypothesis testing table confirms that the only statistically significant difference (at 95% or higher confidence) is between the above Q3 and below Q1 groups, suggesting a meaningful divergence in their return behavior.
This highlights how this framework can help validate or challenge intuitive assumptions about strategy performance through rigorous statistical testing.
Specifically, it:
- Calculates rolling 25th (Q1) and 75th (Q3) percentile levels of price over a user-defined window.
- Classifies returns into three groups based on whether price is above Q3, between Q1 and Q3, or below Q1.
- Computes mean returns and sample sizes for each group.
- Performs Welch's t-tests (which account for unequal variances) between groups to assess if their mean returns differ significantly.
- Displays results in two tables:
- Summary Table: Shows mean ROC and number of observations for each group.
- Hypothesis Testing Table: Shows pairwise t-statistics with significance stars for 95% and 99% confidence levels.
Key Features
- Rolling quantile calculations: Captures local price distributions dynamically.
- Robust hypothesis testing: Welch's t-test allows for heteroskedasticity between groups.
- Significance indicators: Easy visual interpretation with "*" (95%) and "**" (99%) significance levels.
- Visual aids: Plots Q1 and Q3 levels on the price chart for intuitive understanding.
- Extensible and transparent: Fully commented code that emphasizes the evaluation process rather than trading signals.
Important Notes
- Not a trading strategy: This script is intended as a tool for research and validation, not as a standalone trading system.
- Look-ahead bias caution: The calculation carefully avoids look-ahead bias by computing quantiles and ROC values only on past data at each point.
- Users must ensure look-ahead bias is removed when applying this or similar methods, as look-ahead bias would artificially inflate performance and statistical significance.
- The statistical tests rely on the assumption of independent samples, which might not fully hold in financial time series but still provide useful insights
Usage Suggestions
- Use this evaluation framework to validate hypotheses about the behavior of returns under different price regimes.
- Integrate with your strategy development workflow to test whether certain market conditions produce statistically distinct return distributions.
Example
In this example, the script was run with a quantile length of 20 bars and a lookback of 500 bars for ROC classification.
We consider a simple hypothetical "strategy":
- Go long if the previous bar closed above Q3 the 75th percentile).
- Go short if the previous bar closed below Q1 (the 25th percentile).
- Stay in cash if the previous close was between Q1 and Q3.
The screenshot below demonstrates the results of this evaluation. Surprisingly, the "long" group shows a negative average return, while the "short" group has a positive average return, indicating mean reversion rather than trend following.
The hypothesis testing table confirms that the only statistically significant difference (at 95% or higher confidence) is between the above Q3 and below Q1 groups, suggesting a meaningful divergence in their return behavior.
This highlights how this framework can help validate or challenge intuitive assumptions about strategy performance through rigorous statistical testing.
Script open-source
Nello spirito di TradingView, l'autore di questo script lo ha reso open source, in modo che i trader possano esaminarne e verificarne la funzionalità. Complimenti all'autore! Sebbene sia possibile utilizzarlo gratuitamente, ricordiamo che la ripubblicazione del codice è soggetta al nostro Regolamento.
Declinazione di responsabilità
Le informazioni e le pubblicazioni non sono intese come, e non costituiscono, consulenza o raccomandazioni finanziarie, di investimento, di trading o di altro tipo fornite o approvate da TradingView. Per ulteriori informazioni, consultare i Termini di utilizzo.