OPEN-SOURCE SCRIPT
TREND barcolors
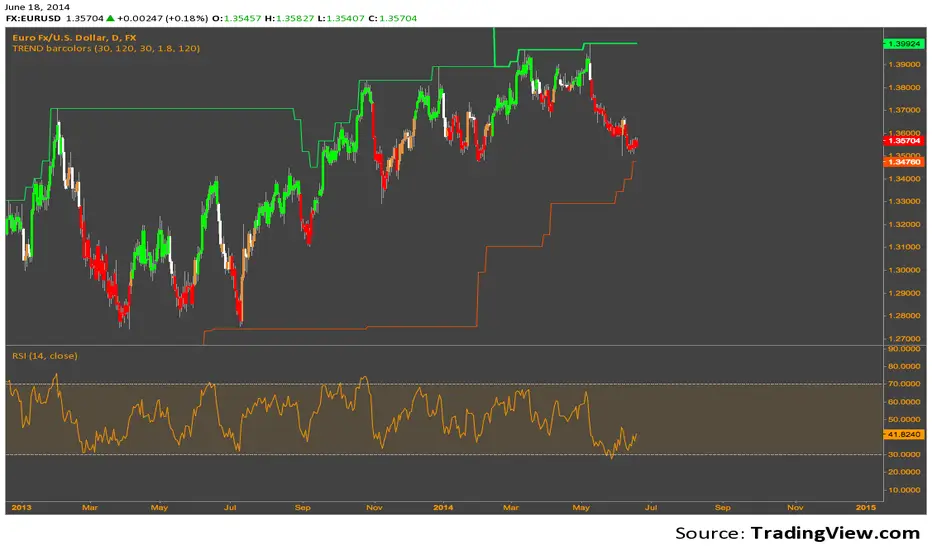
The Donchian values are basically from Ed Sekoytas original statistical run, that gave the values 30 & 120 (aren't as relevant today, but still packs a punch).
The idea of this code is just to take that 30, add a very simple inset of it, with ATR, and color code the bar Green or Red to indicate the direction of the trend. When a new break of the 120 line, (thick line) higher or lower, it typically indicates a bigger bias towards the trend.
It's my first publish, and so a very simple easy to understand system.
Use at your own risk. I cannot be held liable for any damages financial or otherwise, directly or indirectly related to using this script.
Script open-source
In pieno spirito TradingView, il creatore di questo script lo ha reso open-source, in modo che i trader possano esaminarlo e verificarne la funzionalità. Complimenti all'autore! Sebbene sia possibile utilizzarlo gratuitamente, ricorda che la ripubblicazione del codice è soggetta al nostro Regolamento.
Declinazione di responsabilità
Le informazioni ed i contenuti pubblicati non costituiscono in alcun modo una sollecitazione ad investire o ad operare nei mercati finanziari. Non sono inoltre fornite o supportate da TradingView. Maggiori dettagli nelle Condizioni d'uso.