PROTECTED SOURCE SCRIPT
[TehThomas] - ICT SMT Divergences
Introduction
SMT Divergences is a cutting-edge trading tool designed for traders who utilize Smart Money Techniques (SMT), a core concept in the Inner Circle Trader (ICT) methodology. This indicator is specifically built to detect SMT divergences by comparing price action across multiple correlated assets. It helps traders identify institutional activity, liquidity grabs, and inefficiencies in the market, offering valuable insights for high-probability trade setups.
Smart Money Techniques revolve around the idea that institutional traders and large market participants leave behind footprints in the form of price divergences. By analyzing multiple asset pairs simultaneously, this indicator helps traders pinpoint areas where one market structure contradicts another, revealing potential trade opportunities before the majority of retail traders notice them.
What is SMT Divergence?
Smart Money Divergence (SMT) occurs when correlated assets or markets behave differently in key areas of interest. These divergences often indicate market inefficiencies caused by liquidity grabs or institutional order flow. There are two main types of SMT divergences:
1. Bearish SMT Divergence (Smart Money Distribution) 🔴
Occurs when:
📉 Example: If GBP/USD makes a higher high, but EUR/USD makes a lower high, it indicates potential weakness in GBP/USD and a possible short opportunity.
2. Bullish SMT Divergence (Smart Money Accumulation) 🔵
Occurs when:
📈 Example: If NASDAQ (US100) makes a lower low, but S&P 500 (US500) makes a higher low, it could indicate bullish strength in the stock market, suggesting a possible long trade.
How This Indicator Works
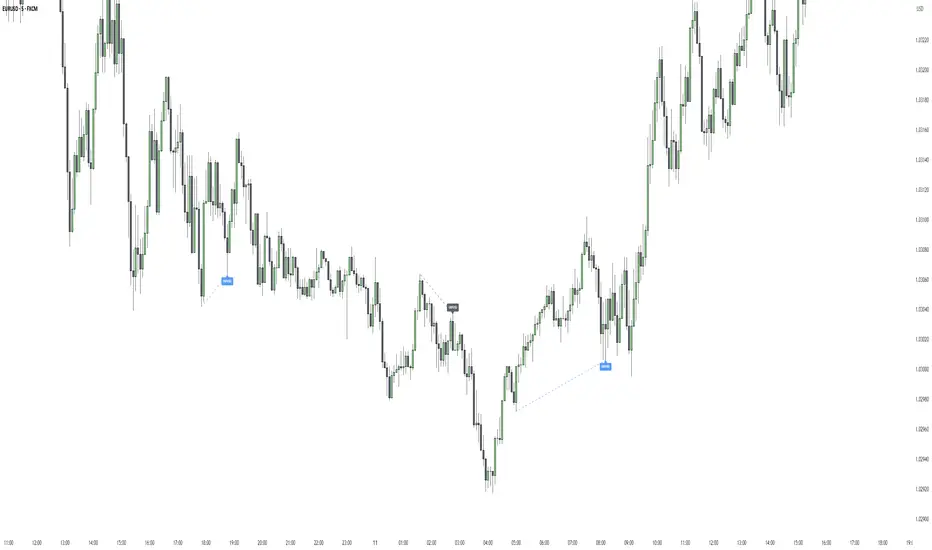
The SMT Divergences automatically identifies and plots SMT divergences on your chart, allowing you to spot hidden market imbalances at a glance.
🔍 Key Features
✅ Compare Up to 4 Assets Simultaneously – Select up to four correlated pairs to compare against the main charted asset.
✅ Automatic Detection of SMT Divergences – The script finds divergences in swing highs and swing lows and visually marks them on the chart.
✅ Customizable Line Styles & Colors – Adjust the appearance of the divergence lines and labels to suit your trading style.
✅ Smart Labeling System – Displays which asset pairs are diverging, making it easy to analyze market conditions.
✅ Works Across Multiple Markets – Use for Forex, Indices, Crypto, and Commodities, giving traders flexibility in different asset classes.
✅ Designed for ICT Traders – Aligns perfectly with other ICT concepts such as Liquidity Zones, Order Blocks, and Fair Value Gaps (FVGs).
🛠 Indicator Settings & Customization
The indicator provides various settings to tailor it to your trading preferences:
How to Use This Indicator in Your Trading Strategy
This indicator is best used in combination with other ICT concepts to improve confluence and increase trade accuracy. Here’s how you can integrate it into your trading strategy:
🔹 Step 1: Identify SMT Divergences
🔹 Step 2: Confirm Institutional Activity
🔹 Step 3: Enter a Trade with Confluence
🔹 Step 4: Manage Risk & Take Profits
Why This Indicator is a Game-Changer for ICT Traders
Traditional retail traders often fail to spot Smart Money footprints, which is why many struggle with false breakouts and liquidity traps. The [TehThomas] - ICT SMT Divergences indicator eliminates this problem by providing a clear, visual representation of SMT divergences, allowing traders to track institutional movements in real-time.
🔹 Save Time – No need to manually compare charts; the script does the work for you.
🔹 Improve Accuracy – Get high-probability trade setups by following institutional footprints.
🔹 Enhance Your Trading Edge – Use SMT divergences in combination with liquidity grabs, order blocks, and fair value gaps to refine your strategy.
🔹 Universal Market Compatibility – Works for Forex, Indices, Crypto, Commodities, and even Stocks, giving you flexibility in different markets.
Final Thoughts
The SMT Divergences is a must-have tool for traders who rely on Smart Money Techniques (SMT) and ICT methodologies. By identifying SMT divergences across multiple correlated markets, this indicator provides unparalleled insights into institutional trading behavior and enhances your ability to trade with Smart Money.
Whether you are a day trader, swing trader, or position trader, this indicator will help you make more informed decisions, avoid liquidity traps, and improve your overall profitability.
__________________________________________
Thanks for your support!
If you found this idea helpful or learned something new, drop a like 👍 and leave a comment, I’d love to hear your thoughts! 🚀
Make sure to follow me for more price action insights, free indicators, and trading strategies. Let’s grow and trade smarter together! 📈
SMT Divergences is a cutting-edge trading tool designed for traders who utilize Smart Money Techniques (SMT), a core concept in the Inner Circle Trader (ICT) methodology. This indicator is specifically built to detect SMT divergences by comparing price action across multiple correlated assets. It helps traders identify institutional activity, liquidity grabs, and inefficiencies in the market, offering valuable insights for high-probability trade setups.
Smart Money Techniques revolve around the idea that institutional traders and large market participants leave behind footprints in the form of price divergences. By analyzing multiple asset pairs simultaneously, this indicator helps traders pinpoint areas where one market structure contradicts another, revealing potential trade opportunities before the majority of retail traders notice them.
What is SMT Divergence?
Smart Money Divergence (SMT) occurs when correlated assets or markets behave differently in key areas of interest. These divergences often indicate market inefficiencies caused by liquidity grabs or institutional order flow. There are two main types of SMT divergences:
1. Bearish SMT Divergence (Smart Money Distribution) 🔴
Occurs when:
- One asset makes a higher high, while another correlated asset makes a lower high.
- This signals underlying weakness in the price action of the first asset.
- Institutions may be offloading positions, preparing for a downward move.
📉 Example: If GBP/USD makes a higher high, but EUR/USD makes a lower high, it indicates potential weakness in GBP/USD and a possible short opportunity.
2. Bullish SMT Divergence (Smart Money Accumulation) 🔵
Occurs when:
- One asset makes a lower low, while another correlated asset makes a higher low.
- This suggests strength and potential accumulation by institutional traders.
- Smart Money may be positioning for a bullish reversal.
📈 Example: If NASDAQ (US100) makes a lower low, but S&P 500 (US500) makes a higher low, it could indicate bullish strength in the stock market, suggesting a possible long trade.
How This Indicator Works
The SMT Divergences automatically identifies and plots SMT divergences on your chart, allowing you to spot hidden market imbalances at a glance.
🔍 Key Features
✅ Compare Up to 4 Assets Simultaneously – Select up to four correlated pairs to compare against the main charted asset.
✅ Automatic Detection of SMT Divergences – The script finds divergences in swing highs and swing lows and visually marks them on the chart.
✅ Customizable Line Styles & Colors – Adjust the appearance of the divergence lines and labels to suit your trading style.
✅ Smart Labeling System – Displays which asset pairs are diverging, making it easy to analyze market conditions.
✅ Works Across Multiple Markets – Use for Forex, Indices, Crypto, and Commodities, giving traders flexibility in different asset classes.
✅ Designed for ICT Traders – Aligns perfectly with other ICT concepts such as Liquidity Zones, Order Blocks, and Fair Value Gaps (FVGs).
🛠 Indicator Settings & Customization
The indicator provides various settings to tailor it to your trading preferences:
- Pivot Lookback Length: Adjusts how many bars the indicator looks back to determine swing highs/lows.
- Symbol Selection: Choose up to four additional assets to compare against your main trading pair.
- Divergence Line Colors: Customize the color of bearish (red) and bullish (blue) divergences for better visibility.
- Line Styles: Choose between solid, dotted, or dashed lines to highlight divergences in your preferred way.
- Label Customization: Modify text color and display preferences for a clean and informative chart layout.
How to Use This Indicator in Your Trading Strategy
This indicator is best used in combination with other ICT concepts to improve confluence and increase trade accuracy. Here’s how you can integrate it into your trading strategy:
🔹 Step 1: Identify SMT Divergences
- Wait for bullish or bearish SMT divergences to appear on your chart.
- Check if the divergence aligns with key liquidity zones, fair value gaps (FVGs), or order blocks.
🔹 Step 2: Confirm Institutional Activity
- Look for liquidity sweeps (stop hunts) before a potential reversal.
- If a bearish SMT divergence forms near a major resistance level, it may signal Smart Money selling.
- If a bullish SMT divergence forms near a support zone, it could indicate accumulation.
🔹 Step 3: Enter a Trade with Confluence
- Combine SMT divergences with market structure shifts to time entries.
- Use additional ICT tools like Premium & Discount Arrays, Volume Profile, and Market Maker Models for confirmation.
- Set stop-losses above liquidity zones and aim for high-risk reward ratios.
🔹 Step 4: Manage Risk & Take Profits
- Always use proper risk management, keeping an eye on liquidity grabs and market sentiment.
- Consider taking partial profits at key structural points and letting the rest of the trade run.
Why This Indicator is a Game-Changer for ICT Traders
Traditional retail traders often fail to spot Smart Money footprints, which is why many struggle with false breakouts and liquidity traps. The [TehThomas] - ICT SMT Divergences indicator eliminates this problem by providing a clear, visual representation of SMT divergences, allowing traders to track institutional movements in real-time.
🔹 Save Time – No need to manually compare charts; the script does the work for you.
🔹 Improve Accuracy – Get high-probability trade setups by following institutional footprints.
🔹 Enhance Your Trading Edge – Use SMT divergences in combination with liquidity grabs, order blocks, and fair value gaps to refine your strategy.
🔹 Universal Market Compatibility – Works for Forex, Indices, Crypto, Commodities, and even Stocks, giving you flexibility in different markets.
Final Thoughts
The SMT Divergences is a must-have tool for traders who rely on Smart Money Techniques (SMT) and ICT methodologies. By identifying SMT divergences across multiple correlated markets, this indicator provides unparalleled insights into institutional trading behavior and enhances your ability to trade with Smart Money.
Whether you are a day trader, swing trader, or position trader, this indicator will help you make more informed decisions, avoid liquidity traps, and improve your overall profitability.
__________________________________________
Thanks for your support!
If you found this idea helpful or learned something new, drop a like 👍 and leave a comment, I’d love to hear your thoughts! 🚀
Make sure to follow me for more price action insights, free indicators, and trading strategies. Let’s grow and trade smarter together! 📈
Script protetto
Questo script è pubblicato come codice protetto. Tuttavia, è possibile utilizzarle liberamente e senza alcuna limitazione – ulteriori informazioni qui.
🔵 Free Discord Community
bit.ly/TehThomas
🔵 Free Telegram Signals
t.me/codeandcandle
🔵 VIP Elite - Learn how to master the markets
linktr.ee/TehThomas
bit.ly/TehThomas
🔵 Free Telegram Signals
t.me/codeandcandle
🔵 VIP Elite - Learn how to master the markets
linktr.ee/TehThomas
Declinazione di responsabilità
Le informazioni e le pubblicazioni non sono intese come, e non costituiscono, consulenza o raccomandazioni finanziarie, di investimento, di trading o di altro tipo fornite o approvate da TradingView. Per ulteriori informazioni, consultare i Termini di utilizzo.