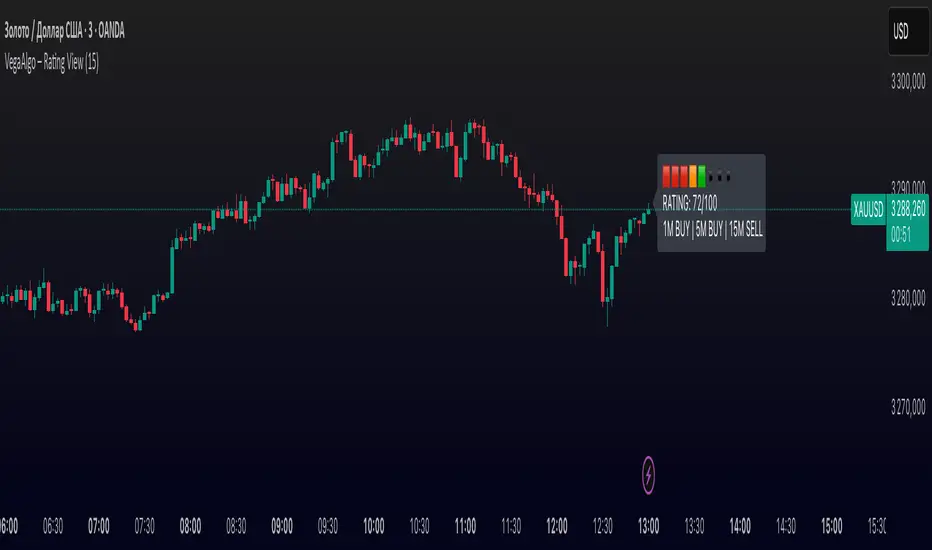
VegaAlgo – Rating ViewVegaAlgo – Rating View is a market condition analysis tool designed to evaluate the current price structure.
The indicator calculates a RATING (from 0 to 100) that reflects how clean, directional, and structured the recent price movement is. The rating is based on the number of price direction changes (from bullish to bearish candles and vice versa) within a selected period. Fewer direction changes indicate a clearer trend and result in a higher rating, while a choppy or highly volatile market leads to a lower score.
Additionally, the indicator provides directional signals on three key timeframes — 1M, 5M, and 15M, using a comparison of fast and slow moving averages. This allows traders to quickly assess the dominant trend both locally and across higher timeframes.
This script is intended for visual market analysis only and should not be considered financial advice.
Sentiment
ADX > 20 and Price Rejection from 50 SMAindicator to show price rejections at 50 SMA with adx above 20

Capitulation Candle Color✅ What It Does:
Candles turn bright green when the score ≥4 (i.e., multiple capitulation signals active).
Otherwise, candles keep their default coloring.
You can visually confirm extreme oversold conditions by seeing these green bars.
Moving averages and the lower Bollinger Band are displayed for context.
✅ How to Customize:
Adjust thresholds (e.g., make ATR threshold less strict).
Change the minimum score to trigger coloring (e.g., ≥3).
Use a different color (color.rgb(0,255,0) for neon green).

💰 Volume Spike Detector - by TenAMTrader💰 Volume Spike Detector – by TenAMTrader
Overview
This indicator helps you spot potential trading opportunities by identifying volume spikes—a common precursor to strong market moves. When a candle's volume exceeds the average volume of the past sessions by a defined percentage (default 25%), a 💰 emoji will appear beneath the bar on your chart.
How to Use It:
Look for the 💰 money sign plotted below candles—these mark when the current volume is significantly higher than usual.
Use these signals to confirm price action setups, trend reversals, or breakout entries.
Combine with support/resistance or other indicators for higher conviction.
Settings & Customization
Spike Ratio %: The percentage above average volume required to trigger a signal (default: 25%).
Trading Period: The number of past bars used to calculate average volume (default: 21).
Enable Alert: Toggle on/off if you want to be alerted when a spike happens.
How to Set Up Alerts
After adding the script to your chart, click the "Alerts" icon.
Choose the condition: Volume Spike Alert.
Set frequency: Once per bar close or Once per bar.
Save and activate to be notified of incoming volume surges.
⚠️ Disclaimer
This indicator is for educational and informational purposes only. It does not constitute financial advice or a recommendation to buy or sell any security. Always perform your own due diligence and risk management. The creator of this script, TenAMTrader, is not liable for any losses incurred from using this tool.

OI Bahavior MapThis indicator visualizes Open Interest (OI) changes for Binance Futures and highlights the behavior of market participants — whether takers or makers are opening or closing positions.
📊 Supported display modes:
• Taker or Maker
• Longs or Shorts
• Cumulative or Per-Bar
• Displayed in USD or Coins
💡 Each candle color reflects the dominant trade direction (delta):
🟢 Green = Aggressive buying (Delta Buy)
🔴 Red = Aggressive selling (Delta Sell)
OI direction (↑/↓) determines whether positions are being opened or closed.
🛠️ Optional metrics:
• Moving average of OI (SMA, EMA, WMA, VWMA, LSMA)
• Volatility channels (Bollinger Bands or Extremums)
⚙️ How it works:
• Fetches OI data from the SYMBOL_OI ticker (e.g., BTCUSDT_OI)
• Compares current OI with the previous bar
• Uses signed volume delta (close - open) to infer intent
• Classifies bar as open/close, long/short, taker/maker
• Displays the net effect as a colored candle on a secondary chart
🤔 How to interpret Taker and Maker?
• Taker: The aggressive participant who removes liquidity (initiates the trade)
• Maker: The passive participant who provides liquidity (places resting orders)
You can choose to display the same event from either the Taker or Maker perspective — the chart will look the same, but the interpretation changes.
🧠 Core Logic Mapping
```
🟢 Green: Taker Longs (Buy, OI↑) | Maker Shorts (Buy, OI↓)
🔴 Red: Taker Shorts (Sell, OI↑) | Maker Longs (Sell, OI↓)
```
⚠️ Limitations:
• Works only for Binance Futures
• Requires existence of SYMBOL_OI ticker on TradingView
• Represents approximate intent based on OI + volume behavior
💬 Open Source
The script is open for the community. Suggestions and feedback are welcome in the comments!
__________________________________________________________________________________
Этот индикатор визуализирует изменения открытого интереса (OI) для Binance Futures и показывает поведение участников рынка — открывают или закрывают позиции тейкеры или мейкеры.
📊 Доступные режимы отображения:
• Taker или Maker
• Longs или Shorts
• Кумулятивный или по бару
• В USD или в монетах
💡 Каждый цвет свечи отражает преобладающее направление сделок (дельта):
🟢 Зеленый = Агрессивные покупки (Delta Buy)
🔴 Красный = Агрессивные продажи (Delta Sell)
Направление OI (↑/↓) показывает, открываются или закрываются позиции.
🛠️ Дополнительные метрики:
• Скользящая средняя OI (SMA, EMA, WMA, VWMA, LSMA)
• Волатильностные каналы (Bollinger Bands или экстремумы)
⚙️ Как работает:
• Получает данные OI из тикера SYMBOL_OI (например, BTCUSDT_OI)
• Сравнивает текущий OI с предыдущим баром
• Использует направленную дельту объема (close - open) для определения намерения
• Классифицирует бар как открытие/закрытие, лонг/шорт, тейкер/мейкер
• Отображает итог в виде цветной свечи на дополнительном графике
🤔 Как интерпретировать Taker и Maker?
• Taker: Агрессивный участник, который изымает ликвидность (инициирует сделку)
• Maker: Пассивный участник, который создает ликвидность (выставляет лимитные заявки)
Вы можете выбрать отображение события с позиции тейкера или мейкера — график будет одинаковым, но смысл меняется.
🧠 Схема логики
```
🟢 Зеленый: Taker Longs (Покупка, OI↑) | Maker Shorts (Покупка, OI↓)
🔴 Красный: Taker Shorts (Продажа, OI↑) | Maker Longs (Продажа, OI↓)
```
⚠️ Ограничения:
• Работает только для Binance Futures
• Требуется наличие тикера SYMBOL_OI на TradingView
• Показывает приблизительное намерение на основе OI и дельты объема
💬 Open Source
Скрипт открыт для сообщества. Предложения и обратная связь приветствуются в комментариях!

Market Strength Dashboard🚀 What It Does:
The indicator gives you a real-time dashboard showing three things:
✅ Trend Direction
Uses EMA 50 vs EMA 200.
Bullish: EMA 50 is above EMA 200 → Price favors upside swing.
Bearish: EMA 50 is below EMA 200 → Price favors downside swing.
Neutral: EMAs are equal → No clear trend.
✅ Momentum Strength
Uses RSI (Relative Strength Index).
Strong Bullish: RSI > 55 → Buyers in control.
Strong Bearish: RSI < 45 → Sellers in control.
Neutral: RSI between 45–55 → No strong momentum, usually sideways or uncertain.
✅ Volatility State (Expansion/Consolidation)
Uses Bollinger Band Width.
Measures if price is:
Expanding: BB Width increasing → Market opening up, volatility rising, often precedes large moves or breakouts.
Contracting: BB Width shrinking → Market compressing, often leads to tight ranges or consolidation.
Stable: No change in BB Width → Range behavior or calm trend.
🔥 How It Works Behind the Scenes:
EMA Cross Check:
→ Looks at whether the faster EMA (50) is above or below the slower EMA (200).
RSI Scan:
→ Reads current RSI level to determine momentum strength.
Bollinger Band Width Scan:
→ Calculates the distance between the upper and lower Bollinger Bands to detect if price is expanding or compressing.
Dashboard Output:
→ Combines all this into a floating label on the chart like:
“Trend: Bullish | Momentum: Strong Bullish | Volatility: Expanding”
🏆 How to Use It — Simple Rules for Swing or Day Trading:
🔥 Ideal Swing Trade Setup:
→ ✅ Trend: Bullish
→ ✅ Momentum: Strong Bullish
→ ✅ Volatility: Expanding
→ → Take long setups → pullbacks to EMA50 or previous highs → ride the trend.
→ ❌ If Trend is Neutral or Volatility is Contracting, skip the trade — market is chopping.
🔥 Ideal Day Trade Setup:
Look for Volatility Expanding → confirms active session/move.
Pair it with either Trend Bullish + Momentum Bullish for longs
→ Or Trend Bearish + Momentum Bearish for shorts.
🔥 When Not to Trade:
Trend Neutral + Momentum Neutral + Contracting Volatility → Sideways chop → No trade zone.
🔥 Breakout Watch Strategy:
When volatility shifts from Contracting → Expanding, expect a breakout.
→ Look for the first candle that pushes away from the Bollinger squeeze.
📊 How To Combine With Other Setups:
→ ✅ Add this dashboard to any chart to instantly know:
Should I be thinking up, down, or neither?
Is this market about to move big or stay stuck?
Pair it with:
Your price action entries.
Support/resistance levels.
Candle patterns.
Trendline or liquidity breaks.
🧠 Bottom Line:
→ This is a market condition scanner, not a signal generator.
→ It tells you: “Should I trade? What’s the direction? Is the market moving or stuck?”
→ You still choose the entry — this tool tells you when conditions are ideal or not.

Key Metrics Dashboard (Float, MCap, ATR) (ValueRay)This dashboard displays critical fundamental and volatility data, saving you from switching screens. It’s perfect for traders who need to quickly assess a stock's character, risk profile, and potential before making a move.
📊 Metrics Included
- Market Cap (MCap): Quickly gauge company size.
- Float: See tradable shares (color-coded for low-float stocks).
- Short %: Measure bearish sentiment and short-squeeze potential (color-coded).
- ATR % & ADR %: Understand true volatility to manage risk.
🚀 Key Features
- Fully Customizable: Toggle any metric on/off to create your ideal view.
- Flexible Layout: Choose your preferred on-chart position, size, and layout (horizontal or vertical).
- Lightweight & Clean: Get essential data without cluttering your chart.
If you find this indicator useful, please give it a Boost (🚀)!
Happy Trading

TPO[Fixed Range, Anchored, Bars Back]TPO Bars Back, Fixed Range and Anchored
Overview
The TPO Profile (Time Price Opportunity Profile) is a powerful market profile indicator that displays the amount of time price spent at different levels during a specified period. Unlike traditional volume profile indicators that show volume distribution, TPO Profile shows time distribution , providing insights into where price has spent the most time and identifying key support and resistance levels.
Key Advantages Over TradingView's Built-in TPO
Simplified Composite Creation : Automatically creates TPO profiles for any time range without manual split/merge operations
Instant Value Area Calculation : Immediately shows Value Area, POC, VAH, and VAL for your selected period
No Manual Assembly Required : TradingView's native TPO requires you to manually split sessions and merge them to create composites - this indicator does it automatically
Flexible Time Ranges : Create composites for any custom time period (multiple days, weeks, specific events) with a few clicks
Real-time Composite Updates : Anchor mode creates live composites that update as new data arrives
Multiple Composite Analysis : Easily compare different time periods without the tedious manual process
Key Features
Core Functionality
Time-Based Analysis : Shows time spent at each price level rather than volume
Configurable Time Blocks : Use any timeframe for TPO counting (30min, 1H, 4H, etc.)
Multiple Price Levels : Adjustable from 5 to 200 levels for granular analysis
Point of Control (POC) : Automatically identifies the price level with highest time activity
Value Area Calculation : Shows the price range containing 70% (configurable) of time activity
Automatic Composite Generation : Creates multi-session composites without manual intervention
Three Operating Modes
1. Bars Back Mode
Analyzes the last N bars from the current bar
Perfect for recent market activity analysis
Range: 10-500 bars
Use Case : Intraday analysis, recent session review
2. Fixed Range Mode
Analyzes a specific time period between start and end times
Ideal for historical analysis of specific events
Creates perfect composites for multi-day periods
Use Case : Earnings periods, news events, specific trading sessions, weekly/monthly composites
3. Anchor Mode (NEW)
Starts from a specific time and extends to the current bar
Dynamically updates as new bars form
Perfect for building live composites from any starting point
Use Case : Live session monitoring, event-based analysis from a specific point, growing composites
Visual Elements
TPO Bars
Horizontal bars showing time distribution at each price level
Longer bars = more time spent at that level
Color-coded to distinguish Value Area from outlying levels
Point of Control (POC)
Red line marking the price level with highest time activity
Most significant support/resistance level
Configurable line style (Solid/Dashed/Dotted) and width
Value Area High/Low (VAH/VAL)
Green and Orange lines marking the boundaries of the Value Area
Shows the price range containing the specified percentage of time activity
Optional display with customizable line styles
Single Print Detection
Identifies price levels touched by only one time block
Display options: Lines or Boxes
Purple color highlighting these significant levels
Often act as strong support/resistance in future trading
Customization Options
Time Block Configuration
Block Time : Choose timeframe for TPO counting (30min, 1H, 4H, etc.)
Allows analysis at different time granularities
Higher timeframes = broader perspective, Lower timeframes = finer detail
Visual Styling
Line Styles : Solid, Dashed, or Dotted for all line elements
Line Widths : 1-5 pixels for POC, VAH, and VAL lines
Colors : Fully customizable colors for all elements
Transparency : Adjustable transparency for better chart readability
Label Management
Show/Hide Labels : Toggle POC, VAH, VAL labels
Font Sizes : Tiny, Small, Normal, Large, Huge
Label Positioning : 8 different position options relative to lines
Offset Controls : Fine-tune label positioning
Line Extension
Level Offset Right : Controls how far lines extend
Smart extension logic:
Value ≤ 0: Infinite extension (extend.right)
Value ≥ 1: Extends exactly N bars ahead
Trading Applications
Support & Resistance
POC often acts as strong support/resistance
Value Area boundaries provide key levels
Single prints frequently become significant levels
Market Structure Analysis
Identify areas of price acceptance (thick TPO bars)
Spot areas of price rejection (thin TPO bars)
Understand where market participants are comfortable trading
Composite Profile Analysis
Create multi-day, weekly, or monthly composites instantly
Compare different composite periods without manual work
Analyze longer-term price acceptance levels
Build composites around specific events or announcements
Session Analysis
Monitor intraday session development in real-time
Compare different sessions (London, New York, Asia)
Track how profiles change throughout the trading day
Build live composites across multiple sessions
Event Analysis
Use Fixed Range mode for earnings, news events
Use Anchor mode to track price development from specific events
Compare pre/post event price acceptance levels
Create event-based composites automatically
Input Parameters
Mode Selection
Mode : Bars Back | Fixed Range | Anchor
Bars Back : Number of bars to analyze (10-500)
Start Time : Beginning time for Fixed Range and Anchor modes
End Time : Ending time for Fixed Range mode only
Analysis Configuration
Block Time : Timeframe for TPO blocks (e.g., "30" for 30-minute blocks)
TPO Levels : Number of price levels (5-200)
Value Area % : Percentage for Value Area calculation (50-95%)
Display Options
Show POC : Display Point of Control line
Show Value Area : Display Value Area box
Show VAH/VAL Lines : Display Value Area boundary lines
Show Single Prints : Display single print detection
Single Print Style : Lines or Boxes
Styling Controls
Colors : TPO, POC, Value Area, VAH, VAL, Single Print colors
Line Styles : POC, VAH, VAL line styles
Line Widths : POC, VAH, VAL line widths
Labels : Show/hide, font size, position, offset controls
Technical Details
Calculation Method
Divides the price range into equal levels based on TPO Levels setting
For each time block, determines which price levels it crosses
Adds +1 count to each crossed level
Identifies POC as the level with highest count
Calculates Value Area by expanding from POC until target percentage is reached
Performance Considerations
Historical data limited to prevent buffer overflow errors
Smart bounds checking for different timeframes
Optimized cleanup routines to prevent drawing object accumulation
Pine Script Version
Built on Pine Script v6
Uses modern Pine Script best practices
Efficient array handling and drawing object management
Best Practices
Timeframe Selection
Block Time = Chart Timeframe : Traditional TPO approach
Block Time > Chart Timeframe : Smoother, broader perspective
Block Time < Chart Timeframe : More granular, detailed analysis
Level Count Guidelines
Low levels (10-20) : Better for swing trading, major levels
High levels (50-100) : Better for scalping, precise entries
Very high levels (100+) : For very detailed analysis
Mode Selection
Bars Back : Daily analysis, recent activity
Fixed Range : Historical events, specific periods, manual composites
Anchor : Live monitoring, event-based analysis, growing composites
Composite Creation Workflow
Select Fixed Range or Anchor mode
Set your desired start time (and end time for Fixed Range)
Adjust TPO Levels for desired granularity
Enable VAH/VAL lines to see Value Area boundaries
The composite profile generates automatically with all key levels
This indicator eliminates the tedious manual process of creating composite TPO profiles in TradingView. Instead of splitting sessions and manually merging them, you get instant composite analysis with automatic Value Area calculation, POC identification, and single print detection. The combination of time-based analysis, multiple operating modes, and extensive customization options makes it a powerful tool for understanding market structure and price acceptance levels across any time period.

SMA Background & Table Indicator# SMA Background & Table Indicator - User Guide
## What is this Indicator?
The **SMA Background & Table Indicator** is a powerful TradingView Pine Script tool that provides instant visual feedback about a stock's position relative to key Simple Moving Averages (SMAs). Instead of cluttering your chart with multiple SMA lines, this indicator uses background colors and a clean table to show you everything you need to know at a glance. You can also set custom time frame for SMA (i.e. Daily chart for SMA calculation) while watching price action in 15 min chart. You will quickly know if SMA200 losses its level on a daily without you having a need to switch back and worth between time frames. A very cool feature.
## Key Features
### 🎨 Smart Background Colors
- **Green Background**: Price is above SMA200 - Bullish trend
- **Red Background**: Price is below SMA200 - Bearish trend
- **Orange Background**: Price is near SMA200 - Caution zone (within 1% threshold)
### 📊 Clean SMA Status Table
Located in the bottom-right corner, showing:
- **SMA5, SMA20, SMA50, SMA100, SMA200** values
- **Color-coded dots** for each SMA:
- 🟢 **Green**: Price is above this SMA (bullish)
- 🟠 **Orange**: Price is close to this SMA (within 0.5%)
- 🔴 **Red**: Price is below this SMA (bearish)
### ⏰ Flexible Timeframe Options
- **Chart Timeframe**: Calculate SMAs from your current chart timeframe
- **Custom Timeframe**: Choose any timeframe (1m, 5m, 1H, 1D, 1W, etc.) for SMA calculations
### 🎨 Full Customization
- **Table Text Size**: Tiny, Small, Normal, Large, or Huge
- **Table Background Color**: Any color you prefer
- **Table Font Color**: Customize text color to match your theme
- **Background Transparency**: Adjust from 0% (opaque) to 100% (transparent)
## How to Use
### Basic Usage
1. **Add the indicator** to any stock chart
2. **Watch the background color** for overall trend direction:
- Green = Bullish (above SMA200)
- Red = Bearish (below SMA200)
- Orange = Neutral/Transition zone
3. **Check the table** for detailed SMA analysis
### Advanced Usage
#### Timeframe Selection
1. Click on the indicator name in the chart
2. Click the **settings gear icon**
3. Enable **"Use Custom Timeframe for SMAs"**
4. Select your preferred **"Custom Timeframe"**
**Example**: You're trading on a 15-minute chart but want to see daily SMA levels:
- Set Custom Timeframe to "1D"
- Now you'll see how the current price relates to daily SMAs while still viewing 15-minute price action
#### Customizing Appearance
In the indicator settings:
- **Table Text Size**: Choose readability preference
- **Table Background Color**: Match your chart theme
- **Table Font Color**: Ensure good contrast
- **Background Transparency**: Balance visibility with chart clarity
## Trading Applications
### Trend Identification
- **Green background** = Look for long opportunities
- **Red background** = Look for short opportunities
- **Orange background** = Wait for clearer direction
### Support/Resistance Levels
- **Green dots** in table = SMAs acting as support
- **Red dots** in table = SMAs acting as resistance
- **Orange dots** = Key levels to watch for breakouts
### Multi-Timeframe Analysis
- Set custom timeframe to higher timeframe (e.g., daily)
- Trade on lower timeframe with higher timeframe SMA context
- Example: Day trading with daily SMA guidance
## Pro Tips
1. **Clean Charts**: This indicator eliminates the need for multiple SMA lines, keeping your chart clean while providing all essential information
2. **Quick Assessment**: One glance tells you the overall trend (background) and detailed SMA relationships (table)
3. **Multi-Timeframe Strategy**: Use daily SMAs on intraday charts for better trend context
4. **Customization**: Adjust colors and transparency to match your trading platform's theme for optimal visibility
5. **Threshold Understanding**:
- Background changes use 1% threshold (reduces noise)
- Table dots use 0.5% threshold (more sensitive)
This indicator transforms complex SMA analysis into simple, actionable visual information - perfect for both beginner and advanced traders!

Alpha Trend Strength Pro🔥 What You’ll See on the Chart
✅ A floating label appears near the most recent candle.
✅ Label shows:
🔥 Trend direction: Uptrend / Downtrend / Neutral / Near VWAP
💪 Trend strength: Strong / Moderate / Weak / Range
📈 EMA alignment
🎯 RSI momentum state
💥 MACD crossover
📊 Volatility condition (Expanding / Contracting)
🔵 VWAP proximity if enabled
✅ The chart background turns:
Green for Uptrend
Red for Downtrend
Neutral/Gray if in range (no background color)
⚙️ Customize Settings
Click the gear icon ⚙️ next to the script’s name on your chart.
Change things like:
Show/hide background color
Toggle VWAP-based filtering
Adjust RSI, MACD, Bollinger parameters

Mongoose Conflict Risk Radar v1.1 (Separate Panel) description
The Mongoose Capital: Risk Rotation Index is a macro market sentiment tool designed to detect elevated risk conditions by aggregating signals across key asset classes.
This script evaluates trend strength across 8 ETFs representing major risk-on and risk-off flows:
GLD – Gold
VIXY – Volatility
TLT – Long-Term Bonds
SPY – S&P 500
UUP – U.S. Dollar Index
EEM – Emerging Markets
SLV – Silver
FXI – China Large-Cap
Each asset is assigned a binary signal based on price position vs. its 21-period SMA (or a crossover for bonds). The signals are then totaled into a composite Risk Rotation Score, plotted as a bar graph.
How to Use
0–2 = Low risk-on behavior
3–4 = Caution / Mixed regime
5–8 = Elevated conflict or macro stress
Use this as a macro confirmation layer for trend entries, risk reduction, or allocation shifts.
Alerts
Set alerts when the index exceeds 5 to track major rotations into defensive assets.

Dashboard Trends📊 Dashboard Trends (Neutral Bias + VWAP Zones)
This indicator displays a real-time trend dashboard across multiple timeframes, enhanced with neutral bias detection and a dynamically visualized VWAP strength zone.
🔍 Core Features
✅ Multi-Timeframe Trend Analysis
Tracks EMA(22) vs EMA(200) on:
1m, 10m, 30m, 4h, and 1D
Includes Neutral Bias Detection:
Uses customizable or ATR-based threshold
Classifies each timeframe as Bullish, Bearish, or Neutral
Neutral conditions are displayed in gray
✅ Anchored VWAP Trend Logic
Daily VWAP line with real-time updates
+1σ and -1σ bands define the price zone
VWAP section evaluates:
Bullish if price is in top 50% above VWAP
Bearish if price is in bottom 50% below VWAP
Neutral if price is within the central 50% zone
VWAP bias shown with color-coded cell and text
✅ Visual Dashboard Table
Clean display in the bottom-right of the chart
Timeframes labeled with Bullish, Bearish, or Neutral
Color-coded per status (green/red/gray)
⚙️ Customization Options
Toggle between fixed or dynamic neutral thresholds
Adjust VWAP standard deviation band size
Control visibility of VWAP line and bands
Fully configurable colors for each condition
This tool is ideal for traders who want a visual trend framework across timeframes, with intelligent bias filtering to avoid false signals during consolidation or indecision. It balances momentum insight with market neutrality awareness, making it powerful for scalpers, swing traders, and intraday setups alike.

MSTR Premium/Discount Analyzer by Marius1032)This indicator provides a transparent, real-time framework for evaluating MicroStrategy Inc. (MSTR) based on its two primary value components:
Bitcoin Holdings (Mark-to-Market)
Core Enterprise Value (ex-Bitcoin)
By calculating the Net Asset Value (NAV) per share from both segments, the indicator enables accurate assessment of whether MSTR is trading at a premium or discount relative to its fundamental value.
📊 Key Metrics Displayed on Chart
MSTR Share Price (Close)
BTC NAV per Share (Holdings × BTC price ÷ Shares Outstanding)
Core NAV per Share (Enterprise Value ÷ Shares Outstanding)
Total NAV per Share (BTC + Core)
Premium / Discount % (Market deviation from NAV)
Manual Timestamp for last data input (auditable)
Input data taken from www.gurufocus.com finance.yahoo.com
🔧 Customizable Inputs
BTC Holdings (default: 592,345 BTC)
BTC Price (manually updated)
Shares Outstanding (default: 266M)
Core Enterprise Value (EV ex-BTC)
Data Timestamp (manual)
🧠 Valuation Logic
The script separates MSTR’s market value into:
Digital Asset Treasury — fully marked to market via BTC price input.
Core Software/Analytics Business — approximated using total enterprise value less BTC exposure.
This two-part decomposition provides a cleaner NAV structure than traditional book value, which is often distorted by high intangible assets (MSTR’s tangible book value is negative as of Q2 2025).
⚠️ Disclosures
All inputs are manual — ensure accuracy by updating with the latest BTC prices and EV disclosures.
Core EV is treated as a constant unless updated, and does not include BTC or speculative adjustments.
Does not model future BTC acquisitions or operational leverage.

Daily & Pre-Market Key LevelsThis can be used to identify Pre market high, Pre market low, Previous day high, Previous day low, Daily high & Daily Low. In between PMH & PML, there is a red shaded area where you do not trade.

Velocity + Momentum (SMA-Based)Velocity + Momentum (SMA-Based) is a clean, powerful oscillator that measures price acceleration using SMA-derived velocity and dual momentum signals. This tool is ideal for identifying directional shifts, exhaustion points, and early entries across any market or timeframe.
How It Works:
This indicator calculates velocity as the distance between the current close and a simple moving average of the open price. Then, it applies two smoothed moving averages to this velocity line:
• Internal Momentum (shorter-term smoothing)
• External Momentum (longer-term context, hidden by default)
The result is a layered view of how fast price is moving and whether that move is gaining or losing strength.
How to Use:
• The green/red histogram shows current velocity (positive = bullish, negative = bearish)
• The teal/maroon line tracks internal momentum and provides short-term signal turns
• The black/gray (hidden) line reflects external momentum and supports broader trend alignment
• Watch for crosses above/below the zero line for confirmation of directional strength
• Use the built-in alerts to catch real-time shifts in all three layers of movement: velocity, internal, and external
Why It's Useful:
• Detects subtle transitions before price structure changes
• Helps filter out noise by comparing short-term vs long-term motion
• Ideal for scalpers, swing traders, and trend-followers alike
• Pairs well with structure-based tools or price action zones
• Works on any asset and timeframe
This indicator simplifies momentum analysis by giving you actionable, multi-layered feedback on how price is accelerating — and when that’s likely to reverse.

Manual VAH/VAL LevelsManual VAH/VAL Levels is a utility indicator that lets traders manually display the Value Area High (VAH) and Value Area Low (VAL) from the prior trading day, based on a Fixed Range Volume Profile tool.
This script is designed to:
Draw horizontal lines at the manually input VAH and VAL levels
Label each line with the corresponding price, aligned clearly to the right of the chart
Display levels only during the regular trading session for focused market context
Maintain a clean chart appearance with transparent label backgrounds
💡 How to Use:
Apply TradingView's Fixed Range Volume Profile tool to the prior day's session
Manually enter the VAH and VAL values into the script settings
The script will draw and label these levels dynamically during the NY market session
This tool is ideal for:
Traders using volume-based key levels for intraday decision-making
Contextualizing price action near areas of prior day value
Confluence analysis when paired with opening range, CVD, or breakout systems

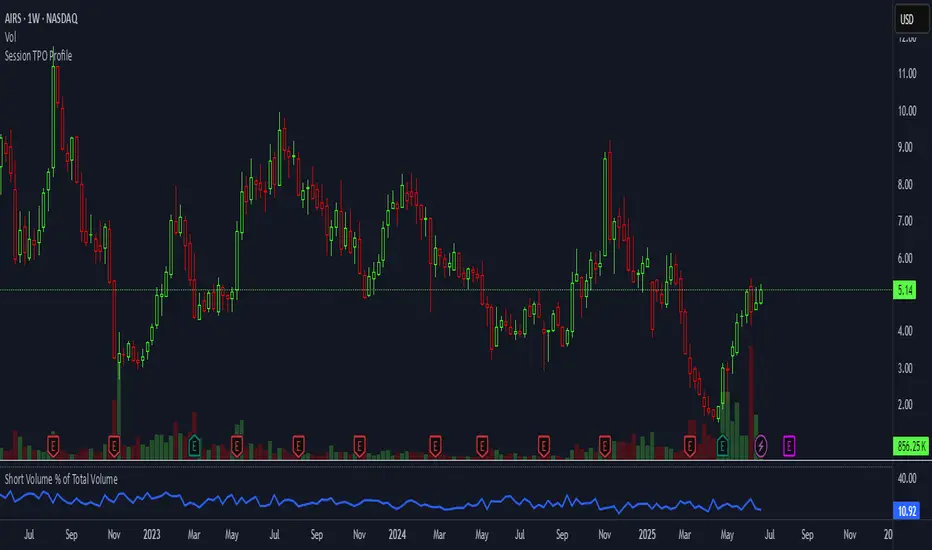
Short Volume % of Total VolumeShort Volume % of Total Volume
This indicator plots the daily short volume as a percentage of total volume for a specific U.S. stock. The short volume is sourced from FINRA’s reported short sale data and is compared against the stock’s total trading volume for the same day.
📊 Use Cases:
Monitor short-selling pressure over time.
Identify spikes in short volume % that may signal increased bearish positioning.
Use in conjunction with price action to gauge sentiment shifts or potential short squeezes.
⚠️ Note: FINRA data reflects activity from FINRA-regulated trading venues only and may not represent full market-wide short activity.
FINRA Short Volume (Daily)FINRA Short Volume (Daily)
This indicator displays the daily short sale volume reported by FINRA for a specific U.S. stock.
🔍 Key Features:
Pulls official FINRA short volume using FINRA: _SHORT_VOLUME
Updates daily, regardless of chart timeframe
Useful for tracking short-selling activity over time
📈 Use Cases:
Identify spikes in short volume that may precede price volatility
Monitor persistent shorting pressure
Combine with price action or other sentiment indicators for squeeze potential
⚠️ Note: This data only includes short sales reported to FINRA — it may not reflect total market-wide short interest. For broader context, use this with other data sources like short interest as a % of float or borrow rates.

Open Interest Footprint IQ [TradingIQ]Hello Traders!
Th e Open Interest Footprint IQ indicator is an advanced visualization tool designed for cryptocurrency markets. It provides a granular, real-time breakdown of open interest changes across different price levels, allowing traders to see how aggressive market participation is distributed within each bar.
Unlike standard footprint charts that rely solely on volume, this indicator offers unique insights by focusing on the interaction between price action and changes in open interest (OI) — a leading metric often used to infer trader intent and positioning.
How it works
The Open Interest Footprint IQ processes lower timeframe price and open interest data to build a footprint-style chart that shows how traders are positioning themselves within each candle.
Here’s a breakdown of the process:
1. Granular OI & Price Sampling
The script retrieves lower-timeframe data (1-minute, 1-second, or 1-tick, based on your setting).
For each candle, it captures:
High and low prices
Price change direction
Change in open interest (OI)
2. Classifying Trader Behavior
For each lower-timeframe segment, the indicator determines the type of positioning occurring based on price movement and OI change:
If price is moving up and open interest is increasing, it suggests that long positions are being opened. This is considered a "Longs Opening" event, labeled as UU (Up/Up).
If price is moving up but open interest is decreasing, it indicates that short positions are being closed. This is referred to as UD (Up/Down), or "Shorts Closing."
If price is moving down and open interest is increasing, it signals that short positions are being opened. This is known as DU (Down/Up), or "Shorts Opening."
If price is moving down while open interest is also decreasing, it means that long positions are being closed. This is labeled as DD (Down/Down), or "Longs Closing."
These are stored in separate arrays and displayed at specific price levels.
It is particularly useful for identifying:
Where longs or shorts are opening/closing positions
Stacked imbalances (indicative of potential absorption or exhaustion)
Value area zones and POC (Point of Control) based on OI, not volume
This footprint runs on your choice of sub-bar granularity and is ideal for high-frequency trading, scalping, and entries based on order flow dynamics.
Key Features
Footprint Visualization
At each price level within a candle:
Long/short opening and closing behavior is broken down.
Delta (net open interest change) is displayed both numerically and color-coded.
Optional gradient coloring shows intensity and type of flow (longs/shorts opened/closed).
Cumulative or per-bar reset modes allow you to track OI evolution over time.
The image above explains the information that each Footprint box shows across a candlestick!
Each footprint box shows:
OI Delta
OI Delta %
Longs Opened (LO)
Longs Closed (LC)
Shorts Opened (SO)
Shorts Closed (SC)
The image above explains the color-coding feature of the indicator.
Boxes are color coded to show which position action
dominated at the price area.
For this example:
Green boxes = Long positions being opened dominated
Purple boxes = Long positions being closed dominated
Red boxes = Short positions being opened dominated
Yellow boxes = Short positions being closed dominated
All colors are customizable.
Additionally, for traders who are only interested in whether OI increased/decreased, a "two-color" option is available in the settings.
For the two-color option, footprint boxes can be one of two colors. Showing whether OI increased or decreased at the level.
Cumulative Levels
Open Interest Footprint IQ contains a "Cumulative Levels" feature that tracks/stores open interest change at tick levels over time, rather than resetting per bar.
With the "Cumulative Levels" feature enabled, traders can see open interest changes persist across all candlesticks. This feature is useful for determining whether longs opening, longs closing, shorts opening, or shorts closing are dominating at particular price areas over time rather than on a single bar.
A useful feature to see if shorts/longs are favoring certain price throughout the day, week, month, etc.
Input Settings Explained
Granularity (Dropdown: Granularity)
Options: 1-Minute, 1-Second, 1-Tick
Determines how finely the script samples the lower timeframe data to construct the footprint.
For precision:
1-Tick = Highest accuracy, but more resource-intensive.
1-Second/1-Minute = Suitable for broader or more zoomed-out analysis.
Tick Level Distance (Tick Level Distance (0 = Auto))
Defines the vertical spacing between levels in the footprint chart.
If 0, the script uses an automatic calculation based on ATR to adapt to volatility.
Set a manual value (e.g., 5) to control the height granularity of each level in ticks.
Cumulative Levels (Toggle)
If enabled, the footprint builds cumulatively over time, rather than resetting per candle.
Use case: Visualize ongoing buildup of OI activity across a session or day.
Cumulative Levels Reset TF (Timeframe)
Sets the reset interval for the cumulative view (e.g., reset daily, hourly, etc.)
Works only when Cumulative Levels is enabled.
Delta Box Display Settings
Show Delta Percentage
Toggles the display of the percentage change in OI across the footprint level.
Helpful to gauge how aggressive positioning is relative to total OI at that level.
Show Longs/Shorts (Opened/Closed)
Show Longs Opened: Displays OI increase in up candles (price ↑, OI ↑).
Show Longs Closed: Displays OI decrease in down candles (price ↓, OI ↓).
Show Shorts Opened: OI increase in down candles (price ↓, OI ↑).
Show Shorts Closed: OI decrease in up candles (price ↑, OI ↓).
These behaviors are color-coded to give traders instant context:
Blue-green for longs opening.
Purple for longs closing.
Red for shorts opening.
Yellow for shorts closing.
Value Area & POC
Value Area % (Value Area %)
Controls how much cumulative open interest is used to define the value area.
Example: 70% means the smallest range of prices that contains 70% of total OI in that bar will be marked.
Helps identify zones of interest, support/resistance, and institutional levels.
The image above explains how to identify the VAH/VAL/POC shown by Open Interest Footprint IQ.
VAH = Upper 🞂
POC = ●
VAL = Lower 🞂
Imbalances
Imbalance Percentage
Defines the minimum delta % required at a level to be marked as an imbalance.
If the net open interest change at a level exceeds this threshold, a visual marker appears.
Stacked Imbalance Count
If the number of consecutive imbalance levels meets this count, a “Stacked Imbalance” alert will trigger.
This can signal aggressive buying or selling pressure, potential breakout zones, or institutional absorption.
Color Settings
Longs Opened / Closed, Shorts Opened / Closed
Customize the color palette for each order flow behavior.
These colors appear in the background gradient of the footprint boxes.
Up/Down Only Mode
Toggle to override all behavior-based colors with a single Up Color and Down Color.
Useful if you prefer a simple bull/bear view.
Up Color / Down Color
If "Up/Down Only" is enabled, these two colors are used to represent all net positive or negative deltas.
Special Notes
Crypto only: This script works only with crypto tickers on TradingView.
For other assets (stocks, futures), a warning message will appear instead.
OI data must be available from the exchange (many perpetual pairs support this).
If the footprint is too small or invisible, increase your tick level spacing in the settings.
Alerts
When a stacked imbalance is detected, an alert is fired ("Stacked Imbalance").
This feature is useful for automated systems, bots, or simply staying informed of potential trade setups.
And that's all for now!
If you have any questions or features you'd like to see feel free to share them in the comments below!
Thank you traders!

Initial balance - weeklyWeekly Initial Balance (IB) — Indicator Description
The Weekly Initial Balance (IB) is the price range (High–Low) established during the week’s first trading session (most commonly Monday). You can measure it over the entire day or just the first X hours (e.g. 60 or 120 minutes). Once that session ends, the IB High and IB Low define the key levels where the initial weekly range formed.
Why Measure the Weekly IB?
Week-Opening Sentiment:
Monday’s range often sets the tone for the rest of the week. Trading above the IB High signals bullish control; trading below the IB Low signals bearish control.
Key Liquidity Zones:
Large institutions tend to place orders around these extremes, so you’ll frequently see tests, breakouts, or rejections at these levels.
Support & Resistance:
The IB High and IB Low become natural barriers. Price will often return to them, bounce off them, or break through them—ideal spots for entries and exits.
Volatility Forecast:
The width of the IB (High minus Low) indicates whether to expect a volatile week (wide IB) or a quieter one (narrow IB).
Significance of IB Levels
Breakout:
A clear break above the IB High (for longs) or below the IB Low (for shorts) can ignite a strong trending move.
Fade:
A rejection off the IB High/Low during low momentum (e.g. low volume or pin-bar formations) offers a high-probability reversal trade.
Mid-Point:
The 50% level of the IB range often “magnetizes” price back to it, providing entry points for continuation or reversal strategies.
Three Core Monday IB Strategies
A. Breakout (Open-Range Breakout)
Entry: Wait for 1–2 candles (e.g. 5-minute) to close above IB High (long) or below IB Low (short).
Stop-Loss: A few pips below IB High (long) or above IB Low (short).
Profit-Target: 2–3× your risk (Reward:Risk ≥ 2:1).
Best When: You spot a clear impulse—such as a strong pre-open volume spike or news-driven move.
B. Fade (Reversal at Extremes)
Entry: When price tests IB High but shows weakening momentum (shrinking volume, upper-wick candles), enter short; vice versa for IB Low and longs.
Stop-Loss: Just beyond the IB extreme you’re fading.
Profit-Target: Back toward the IB mid-point (50% level) or all the way to the opposite IB extreme.
Best When: Monday’s action is range-bound and lacks a clear directional trend.
C. Mid-Point Trading
Entry: When price returns to the 50% level of the IB range.
In an up-trend: buy if it bounces off mid-point back toward IB High.
In a down-trend: sell if it reverses off mid-point back toward IB Low.
Stop-Loss: Just below the nearest swing-low (for longs) or above the nearest swing-high (for shorts).
Profit-Target: To the corresponding IB extreme (High or Low).
Best When: You see a strong initial move away from the IB, followed by a pullback to the mid-point.
Usage Steps
Configure your session: Measure IB over your chosen Monday timeframe (whole day or first X hours).
Choose your strategy: Align Breakout, Fade, or Mid-Point entries with the current market context (trend vs. range).
Manage risk: Keep risk per trade ≤ 1% of account and maintain at least a 2:1 Reward:Risk ratio.
Backtest & forward-test: Verify performance over multiple Mondays and in a paper-trading environment before going live.

Spot vs Near FutureIt will alert when the current price of the spot > near futures price (useful for closing arbitrage positions)

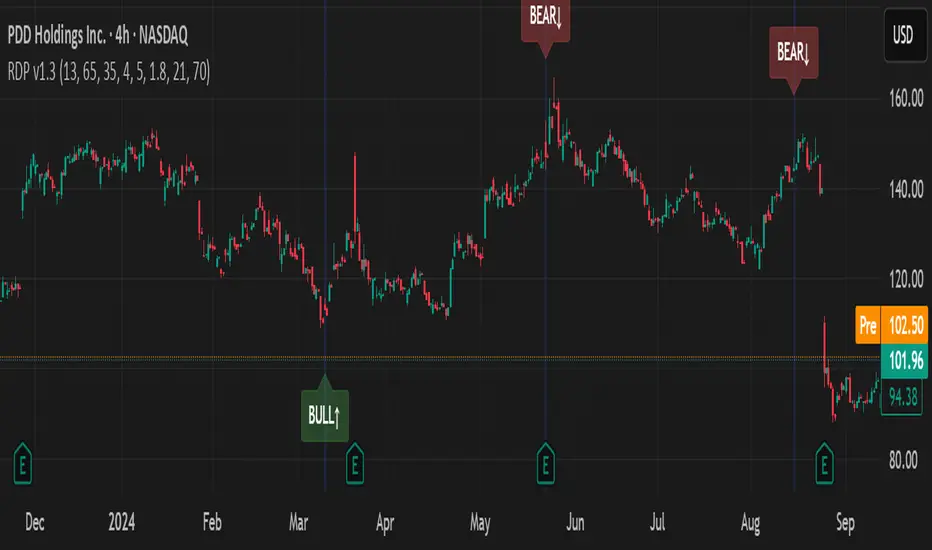
RSI Divergence Pro+ VolumeRSI Divergence Pro+ Volume
What It Does:
RSI Divergence Pro+ Volume is a non-repainting indicator that helps traders spot potential bullish and bearish reversal zones using a classic technical analysis concept—RSI divergence—combined with advanced volume confirmation. The script highlights moments when price and RSI disagree, filtering for signals only when there is a significant volume spike, which helps reduce false positives in quiet or illiquid markets.
How It Works:
Bullish Divergence: Triggered when price makes a lower low but RSI forms a higher low, suggesting possible exhaustion in selling pressure.
Bearish Divergence: Triggered when price makes a higher high but RSI forms a lower high, signaling potential buying exhaustion.
Volume Confirmation: Signals only appear when trading volume exceeds a dynamic threshold (based on a user-defined moving average and multiplier), making alerts more reliable.
Visual Features: Customizable labels and optional gradient highlights mark the exact bars where divergence with volume confirmation occurs, making signals easy to see.
Alert System: Built-in alerts for both bullish and bearish divergences so traders can receive instant notifications.
How to Use:
Apply the script to any timeframe or liquid asset (15m–4H recommended for best results).
Watch for green “BULL↑” labels below bars (bullish divergence) and red “BEAR↓” labels above bars (bearish divergence).
Blue/violet background highlights confirm volume-verified signals.
Combine with your own risk management and confirmation tools for trade entries/exits.
Adjust lookback and volume settings to match your asset and style.
Originality & Usefulness:
This indicator stands out by combining traditional RSI divergence with advanced volume filtering, giving more credible and actionable reversal alerts. All logic is non-repainting and calculated on closed bars only. Settings are fully grouped and customizable, with professional visuals for clarity.
Limitations & Disclaimers:
Not every divergence results in a major reversal—use with other analysis.
More effective in trending or volatile markets; may produce more false signals in choppy/range conditions.
Signals are generated on bar close and do not repaint.
No indicator is a substitute for proper trading discipline and risk management.
TS Multi-Indicator Trend Detector📌 TS Multi-Indicator Trend Detector
This indicator is built for traders who want trend confirmation from multiple technical signals before making a move. It combines 5 powerful trend indicators—EMA, RSI, MACD, ADX, and DMI—into a single score system.
🔍 How It Works
If at least 3 of the 5 indicators confirm a trend, the script plots a floating trend line above the price:
• Yellow Line = Bullish Trend Detected
• Blue Line = Bearish Trend Detected
This makes it easier to visually identify trend bias and filter noise from the market.
🧠 Why It’s Useful
• Helps avoid false signals by requiring confirmation from multiple sources
• Works on any timeframe and instrument
• No repainting
• Fully customizable input values
• Designed for traders who prefer confirmation-based strategies
⸻
✅ Step 3: Screenshots for Publishing
Take 2–3 screenshots on different chart types and timeframes, for example:
1. 1-hour chart on NASDAQ
2. Daily chart on EUR/USD
3. 15-min chart on BTC/USD
Make sure both yellow (bullish) and blue (bearish) lines are shown if possible.
