OPEN-SOURCE SCRIPT
ATR Circle Plot
Title: ATR Circle Plot
Short Title: ATR Circle Plot
Description:
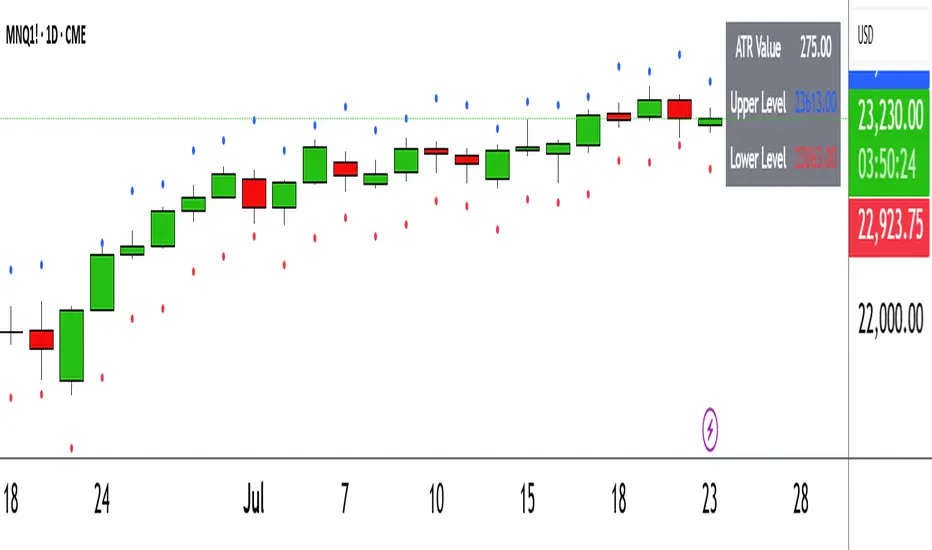
ATR Circle Plot is a dynamic overlay indicator that visualizes volatility-based levels around the open price of each bar, using the Average True Range (ATR). It plots two customizable levels—Upper and Lower ATR—calculated by multiplying the ATR by a user-defined factor (default: 1.0) and adding/subtracting it from the open price. These levels are displayed as colored circles on the chart, ideal for identifying potential breakout or stop-loss zones. A movable table summarizes the ATR value, Upper Level, and Lower Level with tick precision, and a new toggleable label feature displays these values directly on the chart for quick reference.
Perfect for traders in volatile markets like forex, futures, or stocks, this indicator helps set risk parameters or spot key price levels. Users can adjust the ATR timeframe, length, multiplier, table position, and circle colors to suit their strategy. The optional chart labels enhance usability by overlaying ATR metrics at the latest price levels, reducing the need to check the table during fast-moving markets.
Key Features:
Plots Upper and Lower ATR levels as colored circles around the open price.
Toggleable table (top/bottom, left/right) showing ATR and level values in ticks.
Optional chart labels for ATR, Upper, and Lower levels, toggleable via input.
Customizable ATR length, multiplier, timeframe, and colors for flexibility.
Lightweight and compatible with any chart timeframe.
How to Use:
Add the indicator to your chart and adjust the ATR length, multiplier, and timeframe as needed. Enable/disable the table or labels based on your preference. Use the Upper and Lower ATR levels as dynamic support/resistance or stop-loss guides. For example, place stops beyond the Upper/Lower levels or target breakouts when price crosses them. Combine with trend or momentum indicators for a robust setup.
Note: Leave the ATR Timeframe input empty to use the chart’s timeframe, or specify a higher timeframe (e.g., “D” for daily) for broader volatility context. Ensure your chart’s tick size aligns with the asset for accurate table values.
Tags: ATR, volatility, support resistance, stop loss, table, labels, breakout
Category: Volatility
Short Title: ATR Circle Plot
Description:
ATR Circle Plot is a dynamic overlay indicator that visualizes volatility-based levels around the open price of each bar, using the Average True Range (ATR). It plots two customizable levels—Upper and Lower ATR—calculated by multiplying the ATR by a user-defined factor (default: 1.0) and adding/subtracting it from the open price. These levels are displayed as colored circles on the chart, ideal for identifying potential breakout or stop-loss zones. A movable table summarizes the ATR value, Upper Level, and Lower Level with tick precision, and a new toggleable label feature displays these values directly on the chart for quick reference.
Perfect for traders in volatile markets like forex, futures, or stocks, this indicator helps set risk parameters or spot key price levels. Users can adjust the ATR timeframe, length, multiplier, table position, and circle colors to suit their strategy. The optional chart labels enhance usability by overlaying ATR metrics at the latest price levels, reducing the need to check the table during fast-moving markets.
Key Features:
Plots Upper and Lower ATR levels as colored circles around the open price.
Toggleable table (top/bottom, left/right) showing ATR and level values in ticks.
Optional chart labels for ATR, Upper, and Lower levels, toggleable via input.
Customizable ATR length, multiplier, timeframe, and colors for flexibility.
Lightweight and compatible with any chart timeframe.
How to Use:
Add the indicator to your chart and adjust the ATR length, multiplier, and timeframe as needed. Enable/disable the table or labels based on your preference. Use the Upper and Lower ATR levels as dynamic support/resistance or stop-loss guides. For example, place stops beyond the Upper/Lower levels or target breakouts when price crosses them. Combine with trend or momentum indicators for a robust setup.
Note: Leave the ATR Timeframe input empty to use the chart’s timeframe, or specify a higher timeframe (e.g., “D” for daily) for broader volatility context. Ensure your chart’s tick size aligns with the asset for accurate table values.
Tags: ATR, volatility, support resistance, stop loss, table, labels, breakout
Category: Volatility
Script open-source
Nello spirito di TradingView, l'autore di questo script lo ha reso open source, in modo che i trader possano esaminarne e verificarne la funzionalità. Complimenti all'autore! Sebbene sia possibile utilizzarlo gratuitamente, ricordiamo che la ripubblicazione del codice è soggetta al nostro Regolamento.
Declinazione di responsabilità
Le informazioni e le pubblicazioni non sono intese come, e non costituiscono, consulenza o raccomandazioni finanziarie, di investimento, di trading o di altro tipo fornite o approvate da TradingView. Per ulteriori informazioni, consultare i Termini di utilizzo.