OPEN-SOURCE SCRIPT
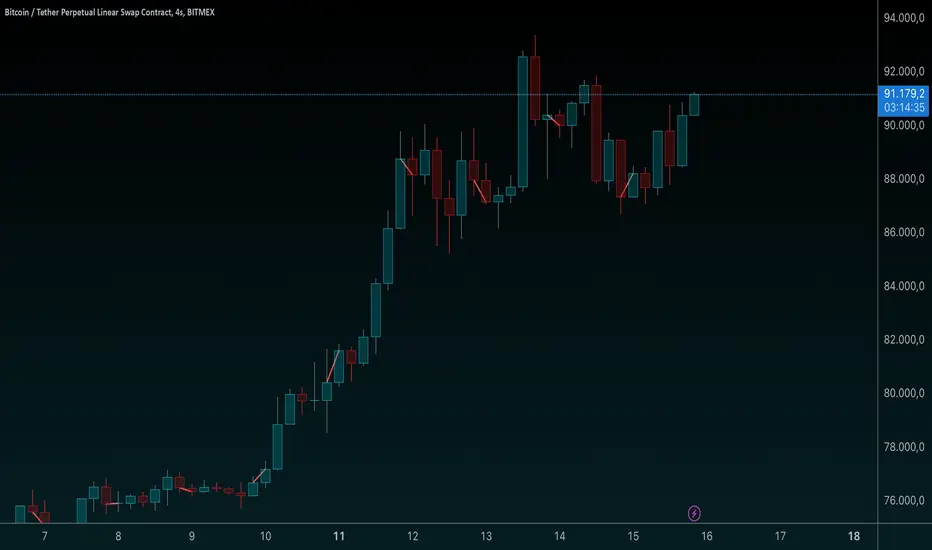
Comprehensive Time Chain Indicator - AYNET

Features and Enhancements
Dynamic Timeframe Handling:
The script monitors new intervals of a user-defined timeframe (e.g., daily, weekly, monthly).
Flexible interval selection allows skipping intermediate time periods (e.g., every 2 days).
Custom Marker Placement:
Markers can be placed at:
High, Low, or Close prices of the bar.
A custom offset above or below the close price.
Special Highlights:
Automatically detects the start of a week (Monday) and the start of a month.
Highlights these periods with a different marker color.
Connecting Lines:
Markers are connected with lines to visually link the events.
Line properties (color, width) are fully customizable.
Dynamic Labels:
Optional labels display the timestamp of the event, formatted as per user preferences (e.g., yyyy-MM-dd HH:mm).
How It Works:
Timeframe Event Detection:
The is_new_interval flag identifies when a new interval begins in the selected timeframe.
Special flags (is_new_week, is_new_month) detect key calendar periods.
Dynamic Marker Drawing:
Markers are drawn using label.new at the specified price levels.
Colors dynamically adjust based on the type of event (interval vs. special highlight).
Connecting Lines:
The script dynamically connects markers with line.new, creating a time chain.
Previous lines are updated for styling consistency.
Customization Options:
Timeframe (main_timeframe):
Adjust the timeframe for detecting new intervals, such as daily, weekly, or hourly.
Interval (interval):
Skip intermediate events (e.g., draw a marker every 2 days).
Visualization:
Enable or disable markers and labels independently.
Customize colors, line width, and marker positions.
Special Periods:
Highlight the start of a week or month with distinct markers.
Applications:
Event Tracking:
Highlight and connect key time intervals for easier analysis of patterns or trends.
Custom Time Chains:
Visualize periodic data, such as specific trading hours or cycles.
Market Session Analysis:
Highlight market opens, closes, or other critical time-based events.
Usage Instructions:
Copy and paste the code into the Pine Script editor on TradingView.
Adjust the input settings for your desired timeframe, visualization preferences, and special highlights.
Apply the script to a chart to see the time chain visualized.
This implementation provides robust functionality while remaining easy to customize. Let me know if further enhancements are required! 😊
Script open-source
Nello spirito di TradingView, l'autore di questo script lo ha reso open source, in modo che i trader possano esaminarne e verificarne la funzionalità. Complimenti all'autore! Sebbene sia possibile utilizzarlo gratuitamente, ricordiamo che la ripubblicazione del codice è soggetta al nostro Regolamento.
Declinazione di responsabilità
Le informazioni e le pubblicazioni non sono intese come, e non costituiscono, consulenza o raccomandazioni finanziarie, di investimento, di trading o di altro tipo fornite o approvate da TradingView. Per ulteriori informazioni, consultare i Termini di utilizzo.