OPEN-SOURCE SCRIPT
Weekly Open to Close Percentage Change
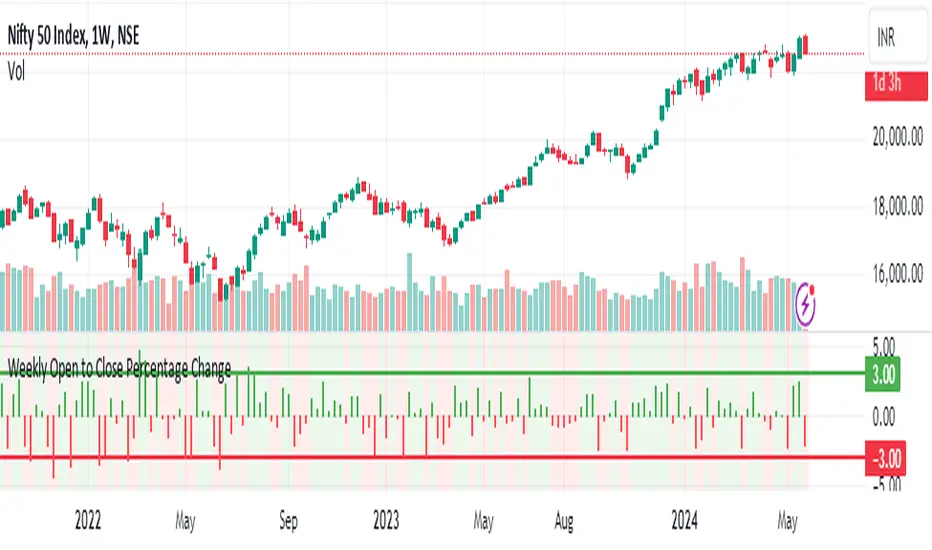
The "Weekly Open to Close Percentage Change Indicator" is a powerful tool designed to help traders and investors track the percentage change in price from the open of the current week's candle to its close. This indicator provides a clear visualization of how the price has moved within the week, offering valuable insights into weekly market trends and momentum.
Key Features:
Weekly Analysis: Focuses on weekly time frames, making it ideal for swing traders and long-term investors.
Percentage Change Calculation: Accurately calculates the percentage change from the open price of the current week's candle to the close price.
Color-Coded Visualization: Uses color coding to differentiate between positive and negative changes:
Green for positive percentage changes (price increase).
Red for negative percentage changes (price decrease).
Histogram Display: Plots the percentage change as a histogram for easy visual interpretation.
Background Highlighting: Adds a background color with transparency to highlight the nature of the change, enhancing chart readability.
Optional Labels: Includes an option to display percentage change values as small dots at the top for quick reference.
How to Use:
Add the script to your TradingView chart by opening the Pine Editor, pasting the script, and saving it.
Apply the indicator to your chart. It will automatically calculate and display the weekly percentage change.
Use the color-coded histogram and background to quickly assess weekly price movements and make informed trading decisions.
Use Cases:
Trend Identification: Quickly identify whether the market is trending upwards or downwards on a weekly basis.
Market Sentiment: Gauge the market sentiment by observing the weekly price changes.
Swing Trading: Ideal for swing traders who base their strategies on weekly price movements.
Note: This indicator is designed for educational and informational purposes. Always conduct thorough analysis and consider multiple indicators and factors when making trading decisions.
Script open-source
Nello spirito di TradingView, l'autore di questo script lo ha reso open source, in modo che i trader possano esaminarne e verificarne la funzionalità. Complimenti all'autore! Sebbene sia possibile utilizzarlo gratuitamente, ricordiamo che la ripubblicazione del codice è soggetta al nostro Regolamento.
Declinazione di responsabilità
Le informazioni e le pubblicazioni non sono intese come, e non costituiscono, consulenza o raccomandazioni finanziarie, di investimento, di trading o di altro tipo fornite o approvate da TradingView. Per ulteriori informazioni, consultare i Termini di utilizzo.