PROTECTED SOURCE SCRIPT
FRM - Bitcoin Fee Ratio Multiple

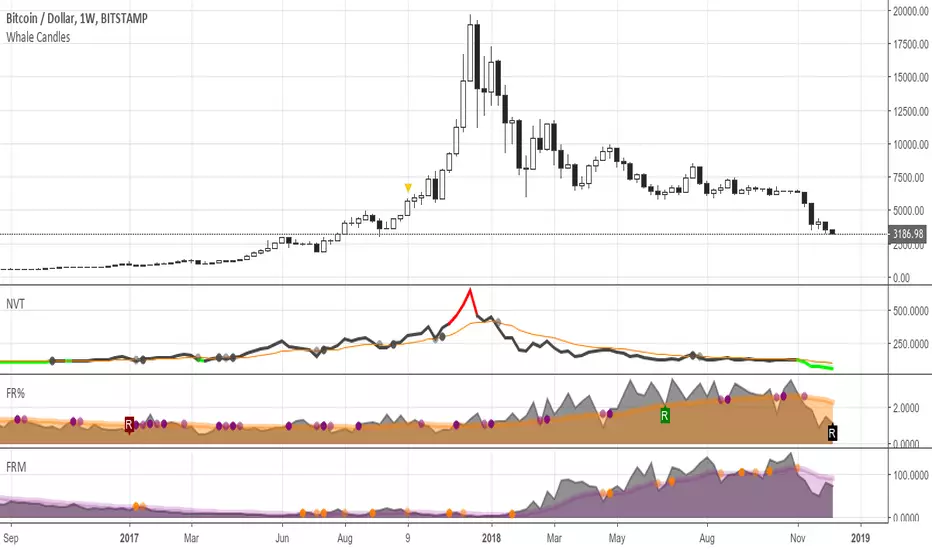
Bitcoin Fee Ratio Multiple (FRM) is a BTC specific study that measures its strength as a Store of Value.
FRM may be a solid alternative to the Network Value to Transaction (NVT) indicator.

A low FRM suggests that Bitcoin can maintain its current security budget (miner revenue) without having to rely on an inflationary subsidy.
Conversely, a high FRM suggests that Bitcoin will require heavy inflation via block reward subsidies in order to maintain its existing security levels.
This means that in order to reach current security budget levels without block reward subsidies, transaction fee revenue for each chain has to grow as many times as the FRM indicator points.
We would naturally expect a strong inverse correlation between large price movements and FRM.
In the long run the correlation between price and FRM would tend to disappear.
FRM for capped supply assets would continue to decline over time, eventually reaching something close to 1, the point at which transaction fee revenue makes up 100% of total miner revenue.
Some notes about NVT.
NVT is used to measure a chain’s strength as a payment network compared to its market value. A low NVT may suggest that a network is undervalued compared to the service it is providing as a settlement layer.
NVT and FRM will not always be correlated. A chain could feasibly have a high number of transactions and a low network value, and therefore a low NVT, while simultaneously having a high FRM depending on the current size of block rewards and average transaction fee.
Moreover, NVT is far easier to spoof than FRM: one merely need spam the network with low fee transactions. By contrast, significant manipulation of FRM would by definition require significant cost as FRM measures the aggregate value of transaction fees rather than count.
User notes:
Credit for this idea goes to Matteo Leibowitz: medium.com/@matteoleibowitz
Based on the story: medium.com/coinmonks/introducing-fee-ratio-multiple-frm-1eada9ac9bec
You're welcome to add it to your charts. Hope you find it useful!
FRM may be a solid alternative to the Network Value to Transaction (NVT) indicator.

A low FRM suggests that Bitcoin can maintain its current security budget (miner revenue) without having to rely on an inflationary subsidy.
Conversely, a high FRM suggests that Bitcoin will require heavy inflation via block reward subsidies in order to maintain its existing security levels.
This means that in order to reach current security budget levels without block reward subsidies, transaction fee revenue for each chain has to grow as many times as the FRM indicator points.
We would naturally expect a strong inverse correlation between large price movements and FRM.
- Strong price action in either direction is usually accompanied by a surge in volume →
- More volume suggests more people are moving assets to exchanges →
- More people transacting with crypto asset means higher transaction fee revenue →
- Therefore, higher transaction fee revenue means lower FRM
In the long run the correlation between price and FRM would tend to disappear.
FRM for capped supply assets would continue to decline over time, eventually reaching something close to 1, the point at which transaction fee revenue makes up 100% of total miner revenue.
Some notes about NVT.
NVT is used to measure a chain’s strength as a payment network compared to its market value. A low NVT may suggest that a network is undervalued compared to the service it is providing as a settlement layer.
NVT and FRM will not always be correlated. A chain could feasibly have a high number of transactions and a low network value, and therefore a low NVT, while simultaneously having a high FRM depending on the current size of block rewards and average transaction fee.
Moreover, NVT is far easier to spoof than FRM: one merely need spam the network with low fee transactions. By contrast, significant manipulation of FRM would by definition require significant cost as FRM measures the aggregate value of transaction fees rather than count.
User notes:
- This study only plots in Bitcoin charts.
- It plots in Daily, Weekly and Monthly time frames.
- It doesn't render in intraday charts.
Credit for this idea goes to Matteo Leibowitz: medium.com/@matteoleibowitz
Based on the story: medium.com/coinmonks/introducing-fee-ratio-multiple-frm-1eada9ac9bec
You're welcome to add it to your charts. Hope you find it useful!
Script protetto
Questo script è pubblicato come codice protetto. Tuttavia, è possibile utilizzarle liberamente e senza alcuna limitazione – ulteriori informazioni qui.
I develop indicators meant to be useful, profitable and good looking.
Declinazione di responsabilità
Le informazioni e le pubblicazioni non sono intese come, e non costituiscono, consulenza o raccomandazioni finanziarie, di investimento, di trading o di altro tipo fornite o approvate da TradingView. Per ulteriori informazioni, consultare i Termini di utilizzo.