OPEN-SOURCE SCRIPT
Tweezer Patterns
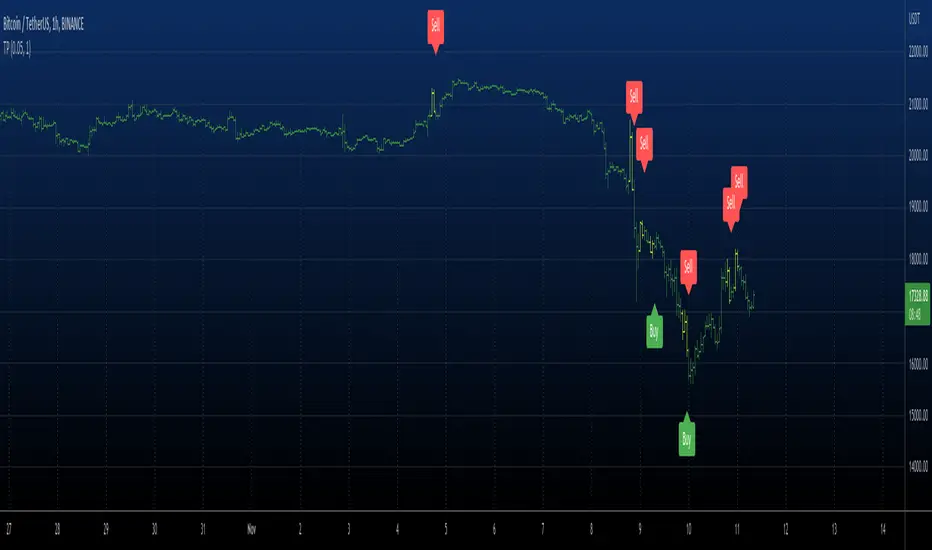
Tweezer top and bottom, also known as tweezers, are reversal candlestick patterns
that signal a potential change in the price direction. Both formations consist of
two candles that occur at the end of a trend, which is in its dying stages.
The tweezer bottom candlestick pattern is a bullish reversal pattern that can be
spotted at the bottom of a downtrend. It consists of two candles, where the first
candle is in line with the bearish trend, while the second candle reflects more
bullish market sentiment as the price bursts higher, in the opposite trend.
The tweezer top candlestick pattern is of the same structure as the tweezer bottom,
except for the fact that it happens at the end of an uptrend, and therefore, it is a
bearish reversal pattern. The first candle is bullish, and it continues in the same
direction, while the second bearish candle indicates that the trend may be changing soon.
Both the bottom and top tweezers are only valid when they occur during uptrends and downtrends.
Their appearance during choppy trading conditions is practically meaningless, and it signals
the market indecision to move in either direction.
WARNING:
- For purpose educate only
- This script to change bars colors.
Script open-source
Nello spirito di TradingView, l'autore di questo script lo ha reso open source, in modo che i trader possano esaminarne e verificarne la funzionalità. Complimenti all'autore! Sebbene sia possibile utilizzarlo gratuitamente, ricordiamo che la ripubblicazione del codice è soggetta al nostro Regolamento.
Declinazione di responsabilità
Le informazioni e le pubblicazioni non sono intese come, e non costituiscono, consulenza o raccomandazioni finanziarie, di investimento, di trading o di altro tipo fornite o approvate da TradingView. Per ulteriori informazioni, consultare i Termini di utilizzo.