OPEN-SOURCE SCRIPT
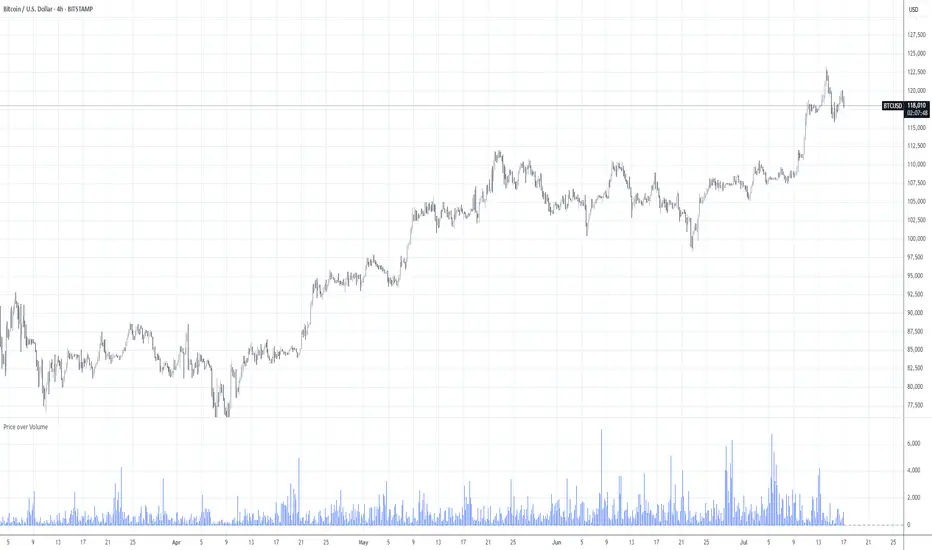
Price over Volume
Version 0.1
Price over Volume Indicator
Description
The Price over Volume indicator calculates the ratio of the closing price to the trading volume (price / volume) for the current chart's symbol and displays it as a histogram in a separate pane. A horizontal zero line is included as a reference to highlight positive and negative values or periods of undefined data (e.g., zero volume). The indicator is designed to help traders analyze the relationship between price movements and trading volume.
Insights Provided
Price-Volume Dynamics: The indicator shows how price per unit of volume fluctuates, offering insights into market efficiency and liquidity. High ratios may indicate low volume relative to price, suggesting potential volatility or thin markets, while low ratios may reflect high volume supporting price stability.
Trend and Momentum Analysis: Spikes or trends in the price-to-volume ratio can signal significant market events, such as buying/selling pressure or low liquidity periods, helping traders identify potential reversals or continuations.
Zero Line Reference: The zero line helps identify periods where the ratio is undefined (e.g., zero volume) or negative (if applicable), aiding in the interpretation of market conditions.
Volume Sensitivity: By normalizing price by volume, the indicator highlights how volume influences price movements, which is useful for assessing the strength of trends or breakouts.
How to Use
Setup: Apply the indicator to any chart with price and volume data (e.g., stocks, cryptocurrencies like BINANCE:BTCUSDT). The histogram appears in a separate pane below the main chart.
Interpretation:
High Ratios: Indicate low trading volume relative to price, potentially signaling overbought conditions or low liquidity. Use with caution in thin markets.
Low Ratios: Suggest high volume supporting price levels, indicating stronger market participation or stability.
Spikes: Watch for sudden increases in the ratio, which may precede volatility or significant price moves.
Zero Line: Periods where the histogram is absent (due to zero volume) indicate no trading activity, useful for identifying illiquid periods.
Trading Applications:
Confirmation Tool: Combine with other indicators (e.g., RSI, MACD) to confirm trend strength. A rising price-to-volume ratio with a price uptrend may indicate weakening volume support, suggesting a potential reversal.
Volume Analysis: Use alongside volume-based indicators (e.g., OBV, VWAP) to assess whether price movements are backed by sufficient volume.
Scalping/Day Trading: Monitor intraday ratio changes to identify high-impact periods with low volume, which may offer short-term trading opportunities.
Customization: Adjust the histogram color or style (e.g., change to line plot) via the Pine Editor to suit your preferences. Consider adding smoothing (e.g., moving average) for cleaner signals.
Notes
Data Requirements: Ensure the chart’s symbol has valid volume data. Symbols with no volume (e.g., some forex pairs) will result in undefined (na) values.
Limitations: The indicator is sensitive to zero-volume periods, which may cause gaps in the histogram. Use on high-liquidity symbols for best results.
Performance: Lightweight and efficient, suitable for all timeframes.
This indicator is ideal for traders seeking to understand the interplay between price and volume, offering a unique perspective on market dynamics for informed trading decisions.
Script open-source
Nello spirito di TradingView, l'autore di questo script lo ha reso open source, in modo che i trader possano esaminarne e verificarne la funzionalità. Complimenti all'autore! Sebbene sia possibile utilizzarlo gratuitamente, ricordiamo che la ripubblicazione del codice è soggetta al nostro Regolamento.
Declinazione di responsabilità
Le informazioni e le pubblicazioni non sono intese come, e non costituiscono, consulenza o raccomandazioni finanziarie, di investimento, di trading o di altro tipo fornite o approvate da TradingView. Per ulteriori informazioni, consultare i Termini di utilizzo.