OPEN-SOURCE SCRIPT
Dividend Payout Ratio

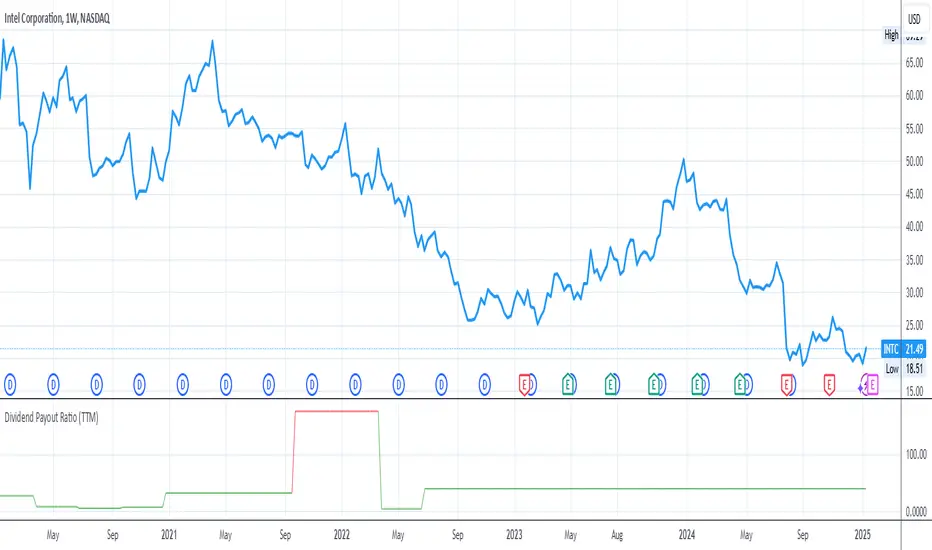
Shows the dividend payout ratio for the specific stock.
The dividend payout ratio indicates if the dividend payout is sustainable in the long run. Therefore,
1. A dividend payout under 50% is considered sustainable. The line will be green
2. A dividend payout over 50% and under 100%, the line will be yellow, is considered a stock to investigate since the dividend payout may have to be cut in the future which will cause the stock price to crash.
3. A dividend payout over 100%, the line will be red, is considered unsustainable and the dividend payout will most likely be cut in the near future. It can take up to a few years for the dividend cut to happen if the financials do not improve.
If the dividend payout ratio is over 100%, this means that the company is paying a dividend amount over $1 for every $1 earned. Therefore, the company must borrow money or find another source to pay the dividend amount that the company cannot afford to pay with the current earnings.
Calculating the dividend payout ratio:
Divide dividend paid by earnings after tax and multiplying the result by 100%.
Script open-source
Nello spirito di TradingView, l'autore di questo script lo ha reso open source, in modo che i trader possano esaminarne e verificarne la funzionalità. Complimenti all'autore! Sebbene sia possibile utilizzarlo gratuitamente, ricordiamo che la ripubblicazione del codice è soggetta al nostro Regolamento.
Declinazione di responsabilità
Le informazioni e le pubblicazioni non sono intese come, e non costituiscono, consulenza o raccomandazioni finanziarie, di investimento, di trading o di altro tipo fornite o approvate da TradingView. Per ulteriori informazioni, consultare i Termini di utilizzo.