OPEN-SOURCE SCRIPT
SmartMind2
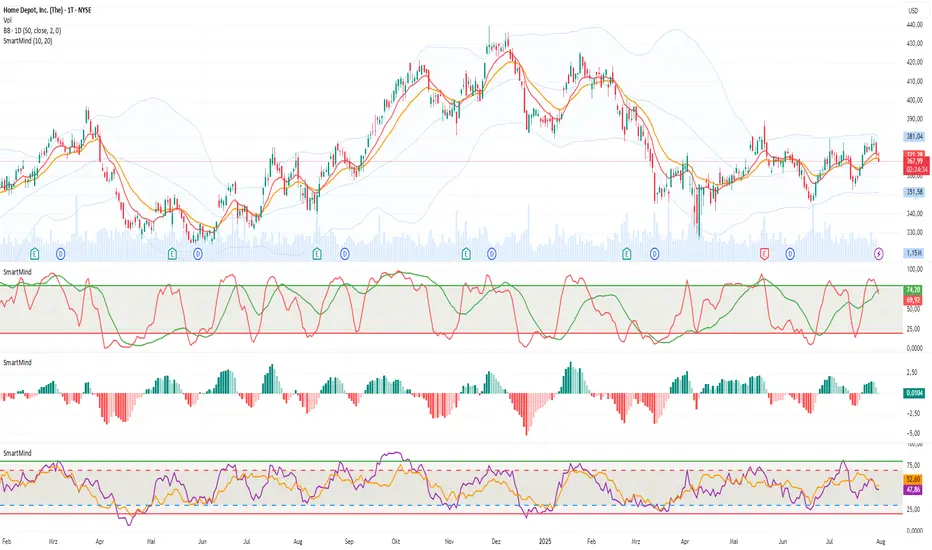
The MACD (Moving Average Convergence Divergence) is a popular technical indicator in trading, primarily used to detect trends and possible reversal points.
How is the MACD structured?
The MACD indicator consists of three components:
MACD Line:
Calculated as the difference between two exponential moving averages (EMAs), commonly 12 and 26 periods.
Formula:
MACD Line
=
𝐸
𝑀
𝐴
12
(
Price
)
−
𝐸
𝑀
𝐴
26
(
Price
)
MACD Line=EMA
12
(Price)−EMA
26
(Price)
Signal Line:
An exponential moving average (usually 9 periods) of the MACD line.
Formula:
Signal Line
=
𝐸
𝑀
𝐴
9
(
MACD Line
)
Signal Line=EMA
9
(MACD Line)
Histogram:
Graphically represents the difference between the MACD line and the Signal line.
Formula:
Histogram
=
MACD Line
−
Signal Line
Histogram=MACD Line−Signal Line
Interpretation of MACD:
Buy Signal: Occurs when the MACD line crosses above the signal line (bullish signal).
Sell Signal: Occurs when the MACD line crosses below the signal line (bearish signal).
Trend Reversal: A divergence between price movements and the MACD indicates a potential reversal (e.g., rising prices with a falling MACD).
Script open-source
Nello spirito di TradingView, l'autore di questo script lo ha reso open source, in modo che i trader possano esaminarne e verificarne la funzionalità. Complimenti all'autore! Sebbene sia possibile utilizzarlo gratuitamente, ricordiamo che la ripubblicazione del codice è soggetta al nostro Regolamento.
Declinazione di responsabilità
Le informazioni e le pubblicazioni non sono intese come, e non costituiscono, consulenza o raccomandazioni finanziarie, di investimento, di trading o di altro tipo fornite o approvate da TradingView. Per ulteriori informazioni, consultare i Termini di utilizzo.