OPEN-SOURCE SCRIPT
Aggiornato L1 MACD Overlay Indicator
Level: 1
Background
MACD is a measure of changes in the dynamics between short-term and longer-term price averages. The sign (positive or negative) and the size or MACD line represent the interaction between the two underlying EMAs.
Function
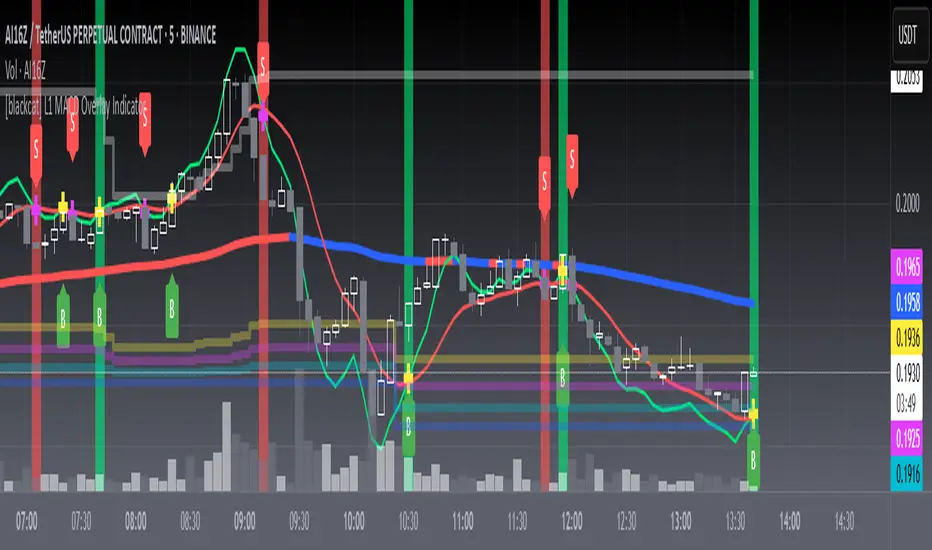
L1 MACD Overlay Indicator is a MACD indicator for main chart. The lime and red color EMAs are the DIFF and DEA signal. I want to plot a contant "Zero Line" line in main chart but failed. So, I use dyanmic color bands to inidcate the "Zero line" in traditioanl MACD. It is not static but a dynamic one.
Key Signal
wdiff --> MACD DIFF
wdea --> MACD DEA
th191 --> zero line
th886 --> zero line
th946 --> zero line
bot --> zero line
Pros and Cons
Pros:
1. main chart MACD
2. easier observation with candles
Cons:
1. I cannot draw static zero line in main chart with PINE, so I draw dyanmic "Zero"
2. No diff-dea histograms
Remarks
I cannot draw static zero line in main chart with PINE, so I draw dyanmic "Zero"
Readme
In real life, I am a prolific inventor. I have successfully applied for more than 60 international and regional patents in the past 12 years. But in the past two years or so, I have tried to transfer my creativity to the development of trading strategies. Tradingview is the ideal platform for me. I am selecting and contributing some of the hundreds of scripts to publish in Tradingview community. Welcome everyone to interact with me to discuss these interesting pine scripts.
The scripts posted are categorized into 5 levels according to my efforts or manhours put into these works.
Level 1 : interesting script snippets or distinctive improvement from classic indicators or strategy. Level 1 scripts can usually appear in more complex indicators as a function module or element.
Level 2 : composite indicator/strategy. By selecting or combining several independent or dependent functions or sub indicators in proper way, the composite script exhibits a resonance phenomenon which can filter out noise or fake trading signal to enhance trading confidence level.
Level 3 : comprehensive indicator/strategy. They are simple trading systems based on my strategies. They are commonly containing several or all of entry signal, close signal, stop loss, take profit, re-entry, risk management, and position sizing techniques. Even some interesting fundamental and mass psychological aspects are incorporated.
Level 4 : script snippets or functions that do not disclose source code. Interesting element that can reveal market laws and work as raw material for indicators and strategies. If you find Level 1~2 scripts are helpful, Level 4 is a private version that took me far more efforts to develop.
Level 5 : indicator/strategy that do not disclose source code. private version of Level 3 script with my accumulated script processing skills or a large number of custom functions. I had a private function library built in past two years. Level 5 scripts use many of them to achieve private trading strategy.
Background
MACD is a measure of changes in the dynamics between short-term and longer-term price averages. The sign (positive or negative) and the size or MACD line represent the interaction between the two underlying EMAs.
Function
L1 MACD Overlay Indicator is a MACD indicator for main chart. The lime and red color EMAs are the DIFF and DEA signal. I want to plot a contant "Zero Line" line in main chart but failed. So, I use dyanmic color bands to inidcate the "Zero line" in traditioanl MACD. It is not static but a dynamic one.
Key Signal
wdiff --> MACD DIFF
wdea --> MACD DEA
th191 --> zero line
th886 --> zero line
th946 --> zero line
bot --> zero line
Pros and Cons
Pros:
1. main chart MACD
2. easier observation with candles
Cons:
1. I cannot draw static zero line in main chart with PINE, so I draw dyanmic "Zero"
2. No diff-dea histograms
Remarks
I cannot draw static zero line in main chart with PINE, so I draw dyanmic "Zero"
Readme
In real life, I am a prolific inventor. I have successfully applied for more than 60 international and regional patents in the past 12 years. But in the past two years or so, I have tried to transfer my creativity to the development of trading strategies. Tradingview is the ideal platform for me. I am selecting and contributing some of the hundreds of scripts to publish in Tradingview community. Welcome everyone to interact with me to discuss these interesting pine scripts.
The scripts posted are categorized into 5 levels according to my efforts or manhours put into these works.
Level 1 : interesting script snippets or distinctive improvement from classic indicators or strategy. Level 1 scripts can usually appear in more complex indicators as a function module or element.
Level 2 : composite indicator/strategy. By selecting or combining several independent or dependent functions or sub indicators in proper way, the composite script exhibits a resonance phenomenon which can filter out noise or fake trading signal to enhance trading confidence level.
Level 3 : comprehensive indicator/strategy. They are simple trading systems based on my strategies. They are commonly containing several or all of entry signal, close signal, stop loss, take profit, re-entry, risk management, and position sizing techniques. Even some interesting fundamental and mass psychological aspects are incorporated.
Level 4 : script snippets or functions that do not disclose source code. Interesting element that can reveal market laws and work as raw material for indicators and strategies. If you find Level 1~2 scripts are helpful, Level 4 is a private version that took me far more efforts to develop.
Level 5 : indicator/strategy that do not disclose source code. private version of Level 3 script with my accumulated script processing skills or a large number of custom functions. I had a private function library built in past two years. Level 5 scripts use many of them to achieve private trading strategy.
Note di rilascio
OVERVIEWThis indicator combines modified Moving Average Convergence Divergence (MACD) calculations with dynamic overlay visuals designed for intraday trading decisions. Integrates custom signal detection mechanisms with support/resistance zone identification based on recent price history.
FEATURES
• Enhanced MACD overlay system using triple-smoothed exponential moving average techniques
• Flag-based signal validation ensuring persistent conditions before triggering alerts
• Color-coded background highlighting active buy/sell phases
• Five-tier resistance/support framework tracking daily extremes over 150 days
• Multi-layer visualization through labeled entry/exit markers ("B"/"S"), momentum lines, and structural thresholds
• Adaptive plotting using advanced filtering functions for accurate value extraction
Features
• Enhanced MACD overlay system using triple smoothed exponential moving average technique
• Flag signal validation to ensure sustained conditions before triggering alerts
• Colored background highlights active buy/sell phases
Five-level resistance/support framework that tracks daily extremes over 150 days
Multi-layered visualization with labeled entry/exit markers ("B"/"S"), momentum lines, and structural thresholds
Adaptive plotting with advanced filtering for accurate value extraction
HOW TO USE
Apply to chart with default parameter presets (M1=60/M2=89)
Monitor crosses between lime (WDIFF) and red (WDEA) momentum lines
Look for confirmed signals only after crossover_lb (15-period) verification
Use plotted resistance levels (h5/h6/h7) to determine profit targets/take-profit zones
Act on "B" labels below bars confirming uptrend triggers, and "S" above bars signaling downtrends
LIMITATIONS
• Fixed 150-day lookback period for structural levels cannot be adjusted
• Historical data dependency may reduce effectiveness on thinly traded pairs
• Relies on previous bar close prices limiting real-time responsiveness
INPUT PARAMETERS
Mid EMA Period: Short-term exponential smoother (default 60)
Long EMA Period: Long-term exponential base (default 89)
Crossover confirmation window (crossover_lb) pre-set to 15 periods
VISUAL ELEMENTS
• Red/blue backgroundEMA (EXP2) showing long-term directional bias
• Stepped reference lines:
White = current swing range top/bottom
Yellow/Fuchsia/Aqua = Fibonacci-relation resistance tiers • Cross-style indicators at exact signal trigger points • Semi-transparent shaded alert areas during active signals
NOTES
• Functions maintain backward compatibility with v4 PineScript engine
• Dynamic recalculation occurs continuously based on latest session activity
• Parameter sensitivity analysis recommended prior to live application
Script open-source
Nello spirito di TradingView, l'autore di questo script lo ha reso open source, in modo che i trader possano esaminarne e verificarne la funzionalità. Complimenti all'autore! Sebbene sia possibile utilizzarlo gratuitamente, ricordiamo che la ripubblicazione del codice è soggetta al nostro Regolamento.
Avoid losing contact!Don't miss out! The first and most important thing to do is to join my Discord chat now! Click here to start your adventure: discord.com/invite/ZTGpQJq 防止失联,请立即行动,加入本猫聊天群: discord.com/invite/ZTGpQJq
Declinazione di responsabilità
Le informazioni e le pubblicazioni non sono intese come, e non costituiscono, consulenza o raccomandazioni finanziarie, di investimento, di trading o di altro tipo fornite o approvate da TradingView. Per ulteriori informazioni, consultare i Termini di utilizzo.