OPEN-SOURCE SCRIPT
Aggiornato [blackcat] L3 Ehlers Spectrogram Indicator
Level: 3
Background
John F. Ehlers introuced Dominant Cycle and Spectrogram Indicator in Mar, 2008.
Function
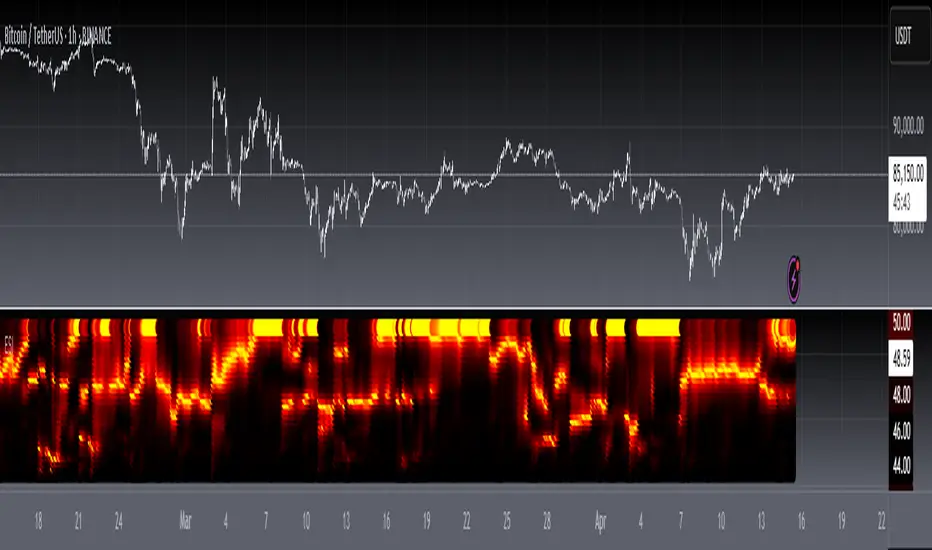
In "Measuring Cycle Periods" in Mar, 2008, John Ehlers presented a very interesting technique of measuring dominant market cycle periods by means of multiple bandpass filtering. By utilizing an approach similar to audio equalizers, the signal (here, the price series) is fed into a set of simple second-order infinite impulse response bandpass filters. Filters are tuned to 8,9,10,...,50 periods. The filter with the highest output represents the dominant cycle. This script implements a high-pass filter and a six-tap low-pass Fir filter on input, then 42 parallel Iir band-pass filters. Finally, it plots the Ehlers spectrogram as a heat map.
Ehlers Spectrogram indicates market power status:
With high market power, the spectrogram become fuzzy;
With low market power, the spectrogram become distinct.
It also discloses market dominant cycles and subcycles, which indicates the major rhythm. Regarding the rhythm of the market, Chinese and Western cultures have reached a consensus: Dr. Ehlers can find the main harmonic components of the market through DSP analysis via spectrum; Master Zen compares the market rhythm to Bach’s fugue from a philosophical perspective, where there is a rhythm of life.
Finally, please allow me to quote Master Zen’s statement on market rhythm:
"The market is cruel. For those who try to violate the market rhythm, the market is their death place; the market is beautiful, and the market is Bach’s fugue. There is a rhythm of life. Rhythm is always the rhythm of the market. A market participant without a sense of rhythm is always torturing. Put aside your greed and fear and listen to the rhythm of the market. In the weekend, let go of everything, but listen to the rhythm of nature, the rhythm of life, the rhythm of music, and then come back to listen to the rhythm of the market. Dancing with the market, your greed and fear are peeled off one by one, you will become very bright."
Key Signal
DomCyc--> Ehlers Dominant Cycle
Plot2~Plot60--> Ehlers Spectrum Heat Map
Pros and Cons
100% John F. Ehlers definition translation, even variable names are the same. This help readers who would like to use pine to read his book.
Remarks
The 73th script for Blackcat1402 John F. Ehlers Week publication.
Readme
In real life, I am a prolific inventor. I have successfully applied for more than 60 international and regional patents in the past 12 years. But in the past two years or so, I have tried to transfer my creativity to the development of trading strategies. Tradingview is the ideal platform for me. I am selecting and contributing some of the hundreds of scripts to publish in Tradingview community. Welcome everyone to interact with me to discuss these interesting pine scripts.
The scripts posted are categorized into 5 levels according to my efforts or manhours put into these works.
Level 1 : interesting script snippets or distinctive improvement from classic indicators or strategy. Level 1 scripts can usually appear in more complex indicators as a function module or element.
Level 2 : composite indicator/strategy. By selecting or combining several independent or dependent functions or sub indicators in proper way, the composite script exhibits a resonance phenomenon which can filter out noise or fake trading signal to enhance trading confidence level.
Level 3 : comprehensive indicator/strategy. They are simple trading systems based on my strategies. They are commonly containing several or all of entry signal, close signal, stop loss, take profit, re-entry, risk management, and position sizing techniques. Even some interesting fundamental and mass psychological aspects are incorporated.
Level 4 : script snippets or functions that do not disclose source code. Interesting element that can reveal market laws and work as raw material for indicators and strategies. If you find Level 1~2 scripts are helpful, Level 4 is a private version that took me far more efforts to develop.
Level 5 : indicator/strategy that do not disclose source code. private version of Level 3 script with my accumulated script processing skills or a large number of custom functions. I had a private function library built in past two years. Level 5 scripts use many of them to achieve private trading strategy.
Background
John F. Ehlers introuced Dominant Cycle and Spectrogram Indicator in Mar, 2008.
Function
In "Measuring Cycle Periods" in Mar, 2008, John Ehlers presented a very interesting technique of measuring dominant market cycle periods by means of multiple bandpass filtering. By utilizing an approach similar to audio equalizers, the signal (here, the price series) is fed into a set of simple second-order infinite impulse response bandpass filters. Filters are tuned to 8,9,10,...,50 periods. The filter with the highest output represents the dominant cycle. This script implements a high-pass filter and a six-tap low-pass Fir filter on input, then 42 parallel Iir band-pass filters. Finally, it plots the Ehlers spectrogram as a heat map.
Ehlers Spectrogram indicates market power status:
With high market power, the spectrogram become fuzzy;
With low market power, the spectrogram become distinct.
It also discloses market dominant cycles and subcycles, which indicates the major rhythm. Regarding the rhythm of the market, Chinese and Western cultures have reached a consensus: Dr. Ehlers can find the main harmonic components of the market through DSP analysis via spectrum; Master Zen compares the market rhythm to Bach’s fugue from a philosophical perspective, where there is a rhythm of life.
Finally, please allow me to quote Master Zen’s statement on market rhythm:
"The market is cruel. For those who try to violate the market rhythm, the market is their death place; the market is beautiful, and the market is Bach’s fugue. There is a rhythm of life. Rhythm is always the rhythm of the market. A market participant without a sense of rhythm is always torturing. Put aside your greed and fear and listen to the rhythm of the market. In the weekend, let go of everything, but listen to the rhythm of nature, the rhythm of life, the rhythm of music, and then come back to listen to the rhythm of the market. Dancing with the market, your greed and fear are peeled off one by one, you will become very bright."
Key Signal
DomCyc--> Ehlers Dominant Cycle
Plot2~Plot60--> Ehlers Spectrum Heat Map
Pros and Cons
100% John F. Ehlers definition translation, even variable names are the same. This help readers who would like to use pine to read his book.
Remarks
The 73th script for Blackcat1402 John F. Ehlers Week publication.
Readme
In real life, I am a prolific inventor. I have successfully applied for more than 60 international and regional patents in the past 12 years. But in the past two years or so, I have tried to transfer my creativity to the development of trading strategies. Tradingview is the ideal platform for me. I am selecting and contributing some of the hundreds of scripts to publish in Tradingview community. Welcome everyone to interact with me to discuss these interesting pine scripts.
The scripts posted are categorized into 5 levels according to my efforts or manhours put into these works.
Level 1 : interesting script snippets or distinctive improvement from classic indicators or strategy. Level 1 scripts can usually appear in more complex indicators as a function module or element.
Level 2 : composite indicator/strategy. By selecting or combining several independent or dependent functions or sub indicators in proper way, the composite script exhibits a resonance phenomenon which can filter out noise or fake trading signal to enhance trading confidence level.
Level 3 : comprehensive indicator/strategy. They are simple trading systems based on my strategies. They are commonly containing several or all of entry signal, close signal, stop loss, take profit, re-entry, risk management, and position sizing techniques. Even some interesting fundamental and mass psychological aspects are incorporated.
Level 4 : script snippets or functions that do not disclose source code. Interesting element that can reveal market laws and work as raw material for indicators and strategies. If you find Level 1~2 scripts are helpful, Level 4 is a private version that took me far more efforts to develop.
Level 5 : indicator/strategy that do not disclose source code. private version of Level 3 script with my accumulated script processing skills or a large number of custom functions. I had a private function library built in past two years. Level 5 scripts use many of them to achieve private trading strategy.
Note di rilascio
b]OVERVIEW The L3 Ehlers Spectrogram Indicator is a technical analysis tool that visualizes market cycles using spectrogram analysis. It identifies dominant cycle periods and displays their strength through color-coded bars.FEATURES
• Calculates dominant cycle periods using Ehlers' proprietary algorithms
• Displays spectrogram analysis across multiple cycle lengths (4-60)
• Visual representation of cycle strength using color gradients
• Smooth visualization with transparent overlays
• Customizable price source input
HOW TO USE
Select your desired price source from the input parameters
Monitor the dominant cycle line for primary trend direction
Observe the spectrogram bars to identify significant cycle periods
Use color intensity to gauge cycle strength: • Red: Strong cycle presence • Yellow: Moderate cycle presence • Green: Weak cycle presence
INPUT PARAMETERS
• Price Source: Select the price data to analyze
INTERPRETATION
• The dominant cycle line shows the current primary market cycle
• Spectrogram bars indicate the strength of each cycle length
• Color intensity correlates with cycle significance
• Higher bars suggest stronger market cycles at those frequencies
LIMITATIONS
• Requires sufficient historical data for accurate calculations
• Signal quality depends on market conditions
• May generate false signals during choppy markets
NOTES
• The script uses Ehlers' proprietary algorithms for cycle detection
• Color coding helps distinguish between different cycle strengths
• The spectrogram provides a comprehensive view of market cycles
Script open-source
Nello spirito di TradingView, l'autore di questo script lo ha reso open source, in modo che i trader possano esaminarne e verificarne la funzionalità. Complimenti all'autore! Sebbene sia possibile utilizzarlo gratuitamente, ricordiamo che la ripubblicazione del codice è soggetta al nostro Regolamento.
Avoid losing contact!Don't miss out! The first and most important thing to do is to join my Discord chat now! Click here to start your adventure: discord.com/invite/ZTGpQJq 防止失联,请立即行动,加入本猫聊天群: discord.com/invite/ZTGpQJq
Declinazione di responsabilità
Le informazioni e le pubblicazioni non sono intese come, e non costituiscono, consulenza o raccomandazioni finanziarie, di investimento, di trading o di altro tipo fornite o approvate da TradingView. Per ulteriori informazioni, consultare i Termini di utilizzo.