OPEN-SOURCE SCRIPT
Aggiornato Volatility ZigZag
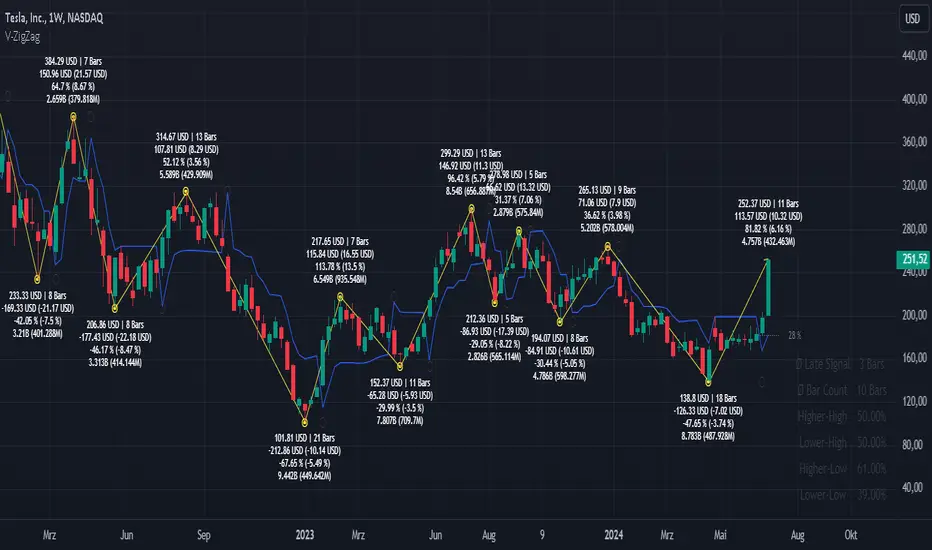
It calculates and plots zigzag lines based on volatility and price movements. It has various inputs for customization, allowing you to adjust parameters like source data, length, deviation, line styling, and labeling options.
The indicator identifies pivot points in the price movement, drawing lines between these pivots based on the deviation from certain price levels or volatility measures.
The script labels various data points at the ZigZag pivot points on the chart. These labels provide information about different aspects of the price movement and volume around these pivot points. Here's a breakdown of what gets labeled:
Price Change: Indicates the absolute and average percentage change between the two pivot points. It displays the absolute or relative change in price as a percentage. Additionally, the average absolute price increase or the average rate of increase can also be labeled.
Volume: Shows the total volume and average volume between the two pivot points.
Number of Bars: Indicates the number of bars between the current and the last pivot point.
Reversal Price: Displays the price of the reversal point (the previous pivot).
Note di rilascio
The labeling of the extended ZigZag line is new. Additionally, there is an alert function available.The design and setting of the ZigZag label annotation have been revised.
Furthermore, the calculation is exported from a library called "Volatility_ZigZag_Library."
Note di rilascio
The Volatility ZigZag Indicator is an advanced tool developed in Pine Script to identify key pivot points in price movements and draw ZigZag lines based on volatility and price changes. Unlike the traditional ZigZag indicator, which relies on fixed deviations, this indicator utilizes various volatility measures such as standard deviation, True Range, and Average True Range to dynamically determine more precise pivot points. This indicator offers a variety of customization options, allowing traders to better understand market structure through the lens of volatility and price movements, enabling them to adjust their trading strategies accordingly.Key Features:
ZigZag Lines: The indicator draws lines between pivot points defined by significant price changes or volatility measures.
Customizable Parameters: Users can adjust parameters such as data source, length, deviation, line style, and labeling options.
Volatility-Based Pivot Points: Pivot points are calculated based on standard deviation, true range, average true range, and a selectable-user-parameter minimum deviation.
Labels and Annotations: The indicator labels pivot points with information on price changes, volume, and the number of bars between pivot points.
Notification Function: There is an integrated alert function that can trigger notifications when new pivot points are formed.
Labeled Data Points:
Price Change: Indicates the absolute and average percentage change between two pivot points. The geometric mean is used for average percentage change because it is better suited for aggregating percentage changes across different periods. Price Change values indicate the magnitude of price movements between pivot points. Higher values suggest more significant price changes, while lower values indicate smaller fluctuations.
Volume: Shows the total and average volume between two pivot points. Interpret within the context of market liquidity and trading activity to gauge the strength of price movements.
Number of Bars: Indicates the number of bars between the current and the last pivot point. Represents the duration of price movements between the current and the last pivot point. Interpret cautiously, considering the pace of market shifts and the significance of timing in trend analysis.
Reversal Price: Displays the price of the reversal point (previous pivot). Displays the price of the previous pivot, providing insight into potential trend reversals.
Standard Deviation and Volatility Measures:
Standard Deviation: A statistical measure that describes the dispersion of price values around the mean. It helps quantify the price volatility.
True Range (TR): The difference between the highest and lowest price of a period, including gaps in the price movement.
Average True Range (ATR): A moving average of the True Range, representing the average volatility over a specified period.
The Deviation H-Line in the Volatility ZigZag indicator dynamically adjusts based on whether the last pivot point was a high or low. When the price crosses this line, a new ZigZag pivot point is signaled, potentially indicating a trend reversal.
Calculation of Pivot Points:
A pivot point is established when the price exceeds a predefined deviation threshold. This deviation is defined as a dynamic value (volatility) or fixed amount based on deviation. If the trend moves sufficiently in the opposite direction and the price crosses the certain threshold, a new pivot point is marked.
Pivot points can be high or low points in the price movement.
Parameter and Data Source
Typically, high and/or low values are used for price data.
• Standard Deviation Calculation: Based on the default source, usually the closing price, or another selected source.
• True Range (TR): The difference between the highest and lowest price of a period, including gaps in the price movement (if high/low source is selected).
• Average True Range (ATR): A moving average of the True Range, representing the average volatility over a specified period (if high/low source is selected).
Length: Determines the number of bars considered for calculations, especially for standard deviation or Average True Range.
Minimum Deviation: Optional setting to establish a minimum deviation for ZigZag lines.
Standard Deviation Factor: Adjustable parameter for the standard deviation.
Notice
The Volatility ZigZag indicator cannot identify future levels because it relies on historical price data and volatility measures to determine pivot points. It reacts only after sufficient price movements have occurred that exceed a predetermined deviation. As a result, pivot points and corresponding ZigZag lines can only be determined retrospectively, after the necessary price changes have already happened. This backward-looking approach makes it impossible to predict future price movements or pivot points.
This is a Pine Script indicator for the public library "Volatility_ZigZag_Library" by me brettkind.
New
The "◯" points have been repositioned to the same Y-coordinate as “⦿”, but the X-coordinate corresponds to the point where the condition for a new ZigZag is true.
The ZigZag label text-size is adjustable from “tiny” to “huge” or “auto”.
Note di rilascio
Updated LibraryScript open-source
In pieno spirito TradingView, il creatore di questo script lo ha reso open-source, in modo che i trader possano esaminarlo e verificarne la funzionalità. Complimenti all'autore! Sebbene sia possibile utilizzarlo gratuitamente, ricorda che la ripubblicazione del codice è soggetta al nostro Regolamento.
Declinazione di responsabilità
Le informazioni ed i contenuti pubblicati non costituiscono in alcun modo una sollecitazione ad investire o ad operare nei mercati finanziari. Non sono inoltre fornite o supportate da TradingView. Maggiori dettagli nelle Condizioni d'uso.
Script open-source
In pieno spirito TradingView, il creatore di questo script lo ha reso open-source, in modo che i trader possano esaminarlo e verificarne la funzionalità. Complimenti all'autore! Sebbene sia possibile utilizzarlo gratuitamente, ricorda che la ripubblicazione del codice è soggetta al nostro Regolamento.
Declinazione di responsabilità
Le informazioni ed i contenuti pubblicati non costituiscono in alcun modo una sollecitazione ad investire o ad operare nei mercati finanziari. Non sono inoltre fornite o supportate da TradingView. Maggiori dettagli nelle Condizioni d'uso.