Zigzag Simple [SCL]🟩 OVERVIEW
Draws zigzag lines from pivot Highs to pivot Lows. You can choose between three different ways of calculating pivots:
• True Highs and Lows
• Williams pivots
• Oscillator pivots
🟩 HOW TO USE
This indicator can be used to understand market structure, which is arguably the primary thing you need to be aware of when trading. The zigzag by itself does not display a market structure bias, nor any information about prices of pivots, HH and HL labels, or anything like that. Nevertheless, a simple zigzag is perhaps the easiest and most intuitive way to understand what price is doing.
Choose a pivot style that you like, customise the colours and line style, and enjoy!
🟩 PIVOT TYPES EXPLAINED
True Highs and Lows
This is not an invention of mine (all credit to my humble mentor), but I haven't seen anyone else code them up. A true High is a close below the low of the candle with the highest high. A true Low is a close above the high of a candle with the lowest low. These are solid, price action-based pivots that can sometimes confirm quickly.
Williams pivots
This is how most people calculate pivots. They're simply the highest high for x bars back and x bars forwards. They're the vanilla of pivots IMO: serviceable but not very interesting. They're very convenient to code because there are built-in Pine functions for them: ta.pivothigh and ta.pivotlow . They confirm a predictable number of bars after they happen, which is great for coding but also makes the trader wait for confirmation.
Oscillator pivots
This is a completely different concept, which uses momentum in order to define pivots. For example, when you get a rise in momentum and momentum then drops a configurable amount, it confirms a pivot high, and vice versa for a pivot low. I don't know if anyone else does it –- although some indicators do mark pivots in momentum itself, and plenty do divergences, I wasn't able to find one that specifically marked *pivots in price* because of pivots in momentum 🤷♂️
Anyway, while this approach needs a whole investigation on its own, here we simply plot some pivots in a smoothed RSI. This indicator doesn't plot the actual momentum values -- for a more visual understanding of how this works, refer to the examples in the OscillatorPivots library.
🟩 UNIQUE ADVANTAGES
In contrast to other zigzag indicators available, this one lets you choose between the standard and some more unique methods of generating the zigzags. Additionally, because it's based on libraries, it is relatively easy for programmers to use as a basis for experimentation.
🟩 GEEK STUFF
Although there is considerable practical use for pivot-based zigzags in trading, this script is primarily a demonstration in coding -- specifically the power of libraries!
Most of the script consists of setup, especially defining inputs. The final section sacrifices some readability for conciseness, simply to emphasise how little code you need when the heavy lifting is done by libraries .
The actual calculations and drawing are achieved in just 8 lines.
The equivalent code in the libraries is ~250 lines long.
All libraries used are my own, public and open-source:
• MarketStructure
• DrawZigZag
• OscillatorPivots
Zigzag

ZigZag ProZigZag Pro is a precise market structure indicator that automatically detects two independent ZigZag patterns and highlights breakouts whenever significant highs or lows are breached.
The indicator calculates two separate ZigZag structures in real time. ZigZag1 captures the broader market swings and is ideal for trend or swing trading. ZigZag2 is optional and reacts more quickly – perfect for intraday or scalping setups. Both layers are fully customizable in terms of depth, color, and line width.
What makes this tool especially useful: whenever a previous swing high (for long trades) or swing low (for short trades) is broken, the indicator draws a horizontal breakout line on the chart. This makes it easy to spot structural breakouts and take advantage of potential momentum moves.
ZigZag Pro is designed for traders who rely on clean, rule-based market structure — whether you're trading classic breakouts, smart money concepts, or simply want a clearer view of trend shifts. The visuals are minimal, responsive, and suitable for any timeframe.

Zig Zag Trend Metrics“ Zig Zag Trend Metrics ” is a highly versatile indicator, built on the classic Zig Zag concept and thoughtfully designed for technical traders seeking a deeper, more structured view of market dynamics. This tool identifies significant swing highs and lows, classifies them, and annotates each with key metrics, offering a precise snapshot of each movement. It enhances visual analysis by drawing connecting lines that outline the flow of market structure, making trend progression and reversals instantly recognizable. Beyond visual mapping, it features a compact, real-time statistics table that calculates the average price and time deltas for both bullish and bearish swings, giving traders deep insights into trend momentum and rhythm. With extensive customization options, this indicator adapts seamlessly to vast trading styles or chart setups, empowering traders to spot patterns, evaluate trend strength, and make more confident, data-backed decisions.
❖ FEATURES
✦ Automatic Swing Detection
At its core, this indicator automatically identifies swing highs and lows based on a customizable lookback period (default: 10 bars).
✦ Labeling Swing Points
Each swing is visualized with a label that includes:
Swing Classification : “HH” (Higher High), “LH” (Lower High), “LL” (Lower Low), or “HL” (Higher Low).
Price Difference : Displayed in percentage or absolute value from the previous opposite swing.
Time Difference : The number of bars since the previous swing of the opposite type.
These labels offer traders clear, immediate insight into price movements and structural changes.
✦ Visual Lines
The indicator draws three types of lines:
Bullish Lines: Connect recent swing lows to new swing highs, indicating uptrends.
Bearish Lines: Connect recent swing highs to new swing lows, indicating downtrends.
Range Lines: Connect consecutive highs or lows to outline price channels.
Each line type can be color-coded and customized for visibility.
✦ Statistics Table
An on-screen metrics table provides a live summary of trends. Script uses Relative Averaging to smooth price and time changes. This prevents outliers from distorting the data and provides a more reliable sense of typical swing behavior.
Uptrend Metrics: Shows average price and time differences from recent bullish swings.
Downtrend Metrics: Shows the same for bearish swings.
🛠️ Customization Options
Ability to tailor the indicator to suit their strategy and aesthetic preferences:
Swing Period: Adjust sensitivity to short- or long-term swings.
Color Settings: Customize line and label colors.
Label Display: Choose between absolute or percentage price differences.
Table Settings: Modify size, location, or visibility.
This makes the indicator highly flexible and useful across various timeframes and assets.

ZigZag█ Overview
This Pine Script™ library provides a comprehensive implementation of the ZigZag indicator using advanced object-oriented programming techniques. It serves as a developer resource rather than a standalone indicator, enabling Pine Script™ programmers to incorporate sophisticated ZigZag calculations into their own scripts.
Pine Script™ libraries contain reusable code that can be imported into indicators, strategies, and other libraries. For more information, consult the Libraries section of the Pine Script™ User Manual.
█ About the Original
This library is based on TradingView's official ZigZag implementation .
The original code provides a solid foundation with user-defined types and methods for calculating ZigZag pivot points.
█ What is ZigZag?
The ZigZag indicator filters out minor price movements to highlight significant market trends.
It works by:
1. Identifying significant pivot points (local highs and lows)
2. Connecting these points with straight lines
3. Ignoring smaller price movements that fall below a specified threshold
Traders typically use ZigZag for:
- Trend confirmation
- Identifying support and resistance levels
- Pattern recognition (such as Elliott Waves)
- Filtering out market noise
The algorithm identifies pivot points by analyzing price action over a specified number of bars, then only changes direction when price movement exceeds a user-defined percentage threshold.
█ My Enhancements
This modified version extends the original library with several key improvements:
1. Support and Resistance Visualization
- Adds horizontal lines at pivot points
- Customizable line length (offset from pivot)
- Adjustable line width and color
- Option to extend lines to the right edge of the chart
2. Support and Resistance Zones
- Creates semi-transparent zone areas around pivot points
- Customizable width for better visibility of important price levels
- Separate colors for support (lows) and resistance (highs)
- Visual representation of price areas rather than just single lines
3. Zig Zag Lines
- Separate colors for upward and downward ZigZag movements
- Visually distinguishes between bullish and bearish price swings
- Customizable colors for text
- Width customization
4. Enhanced Settings Structure
- Added new fields to the Settings type to support the additional features
- Extended Pivot type with supportResistance and supportResistanceZone fields
- Comprehensive configuration options for visual elements
These enhancements make the ZigZag more useful for technical analysis by clearly highlighting support/resistance levels and zones, and providing clearer visual cues about market direction.
█ Technical Implementation
This library leverages Pine Script™'s user-defined types (UDTs) to create a robust object-oriented architecture:
- Settings : Stores configuration parameters for calculation and display
- Pivot : Represents pivot points with their visual elements and properties
- ZigZag : Manages the overall state and behavior of the indicator
The implementation follows best practices from the Pine Script™ User Manual's Style Guide and uses advanced language features like methods and object references. These UDTs represent Pine Script™'s most advanced feature set, enabling sophisticated data structures and improved code organization.
For newcomers to Pine Script™, it's recommended to understand the language fundamentals before working with the UDT implementation in this library.
█ Usage Example
//@version=6
indicator("ZigZag Example", overlay = true, shorttitle = 'ZZA', max_bars_back = 5000, max_lines_count = 500, max_labels_count = 500, max_boxes_count = 500)
import andre_007/ZigZag/1 as ZIG
var group_1 = "ZigZag Settings"
//@variable Draw Zig Zag on the chart.
bool showZigZag = input.bool(true, "Show Zig-Zag Lines", group = group_1, tooltip = "If checked, the Zig Zag will be drawn on the chart.", inline = "1")
// @variable The deviation percentage from the last local high or low required to form a new Zig Zag point.
float deviationInput = input.float(5.0, "Deviation (%)", minval = 0.00001, maxval = 100.0,
tooltip = "The minimum percentage deviation from a previous pivot point required to change the Zig Zag's direction.", group = group_1, inline = "2")
// @variable The number of bars required for pivot detection.
int depthInput = input.int(10, "Depth", minval = 1, tooltip = "The number of bars required for pivot point detection.", group = group_1, inline = "3")
// @variable registerPivot (series bool) Optional. If `true`, the function compares a detected pivot
// point's coordinates to the latest `Pivot` object's `end` chart point, then
// updates the latest `Pivot` instance or adds a new instance to the `ZigZag`
// object's `pivots` array. If `false`, it does not modify the `ZigZag` object's
// data. The default is `true`.
bool allowZigZagOnOneBarInput = input.bool(true, "Allow Zig Zag on One Bar", tooltip = "If checked, the Zig Zag calculation can register a pivot high and pivot low on the same bar.",
group = group_1, inline = "allowZigZagOnOneBar")
var group_2 = "Display Settings"
// @variable The color of the Zig Zag's lines (up).
color lineColorUpInput = input.color(color.green, "Line Colors for Up/Down", group = group_2, inline = "4")
// @variable The color of the Zig Zag's lines (down).
color lineColorDownInput = input.color(color.red, "", group = group_2, inline = "4",
tooltip = "The color of the Zig Zag's lines")
// @variable The width of the Zig Zag's lines.
int lineWidthInput = input.int(1, "Line Width", minval = 1, tooltip = "The width of the Zig Zag's lines.", group = group_2, inline = "w")
// @variable If `true`, the Zig Zag will also display a line connecting the last known pivot to the current `close`.
bool extendInput = input.bool(true, "Extend to Last Bar", tooltip = "If checked, the last pivot will be connected to the current close.",
group = group_1, inline = "5")
// @variable If `true`, the pivot labels will display their price values.
bool showPriceInput = input.bool(true, "Display Reversal Price",
tooltip = "If checked, the pivot labels will display their price values.", group = group_2, inline = "6")
// @variable If `true`, each pivot label will display the volume accumulated since the previous pivot.
bool showVolInput = input.bool(true, "Display Cumulative Volume",
tooltip = "If checked, the pivot labels will display the volume accumulated since the previous pivot.", group = group_2, inline = "7")
// @variable If `true`, each pivot label will display the change in price from the previous pivot.
bool showChgInput = input.bool(true, "Display Reversal Price Change",
tooltip = "If checked, the pivot labels will display the change in price from the previous pivot.", group = group_2, inline = "8")
// @variable Controls whether the labels show price changes as raw values or percentages when `showChgInput` is `true`.
string priceDiffInput = input.string("Absolute", "", options = ,
tooltip = "Controls whether the labels show price changes as raw values or percentages when 'Display Reversal Price Change' is checked.",
group = group_2, inline = "8")
// @variable If `true`, the Zig Zag will display support and resistance lines.
bool showSupportResistanceInput = input.bool(true, "Show Support/Resistance Lines",
tooltip = "If checked, the Zig Zag will display support and resistance lines.", group = group_2, inline = "9")
// @variable The number of bars to extend the support and resistance lines from the last pivot point.
int supportResistanceOffsetInput = input.int(50, "Support/Resistance Offset", minval = 0,
tooltip = "The number of bars to extend the support and resistance lines from the last pivot point.", group = group_2, inline = "10")
// @variable The width of the support and resistance lines.
int supportResistanceWidthInput = input.int(1, "Support/Resistance Width", minval = 1,
tooltip = "The width of the support and resistance lines.", group = group_2, inline = "11")
// @variable The color of the support lines.
color supportColorInput = input.color(color.red, "Support/Resistance Color", group = group_2, inline = "12")
// @variable The color of the resistance lines.
color resistanceColorInput = input.color(color.green, "", group = group_2, inline = "12",
tooltip = "The color of the support/resistance lines.")
// @variable If `true`, the support and resistance lines will be drawn as zones.
bool showSupportResistanceZoneInput = input.bool(true, "Show Support/Resistance Zones",
tooltip = "If checked, the support and resistance lines will be drawn as zones.", group = group_2, inline = "12-1")
// @variable The color of the support zones.
color supportZoneColorInput = input.color(color.new(color.red, 70), "Support Zone Color", group = group_2, inline = "12-2")
// @variable The color of the resistance zones.
color resistanceZoneColorInput = input.color(color.new(color.green, 70), "", group = group_2, inline = "12-2",
tooltip = "The color of the support/resistance zones.")
// @variable The width of the support and resistance zones.
int supportResistanceZoneWidthInput = input.int(10, "Support/Resistance Zone Width", minval = 1,
tooltip = "The width of the support and resistance zones.", group = group_2, inline = "12-3")
// @variable If `true`, the support and resistance lines will extend to the right of the chart.
bool supportResistanceExtendInput = input.bool(false, "Extend to Right",
tooltip = "If checked, the lines will extend to the right of the chart.", group = group_2, inline = "13")
// @variable References a `Settings` instance that defines the `ZigZag` object's calculation and display properties.
var ZIG.Settings settings =
ZIG.Settings.new(
devThreshold = deviationInput,
depth = depthInput,
lineColorUp = lineColorUpInput,
lineColorDown = lineColorDownInput,
textUpColor = lineColorUpInput,
textDownColor = lineColorDownInput,
lineWidth = lineWidthInput,
extendLast = extendInput,
displayReversalPrice = showPriceInput,
displayCumulativeVolume = showVolInput,
displayReversalPriceChange = showChgInput,
differencePriceMode = priceDiffInput,
draw = showZigZag,
allowZigZagOnOneBar = allowZigZagOnOneBarInput,
drawSupportResistance = showSupportResistanceInput,
supportResistanceOffset = supportResistanceOffsetInput,
supportResistanceWidth = supportResistanceWidthInput,
supportColor = supportColorInput,
resistanceColor = resistanceColorInput,
supportResistanceExtend = supportResistanceExtendInput,
supportResistanceZoneWidth = supportResistanceZoneWidthInput,
drawSupportResistanceZone = showSupportResistanceZoneInput,
supportZoneColor = supportZoneColorInput,
resistanceZoneColor = resistanceZoneColorInput
)
// @variable References a `ZigZag` object created using the `settings`.
var ZIG.ZigZag zigZag = ZIG.newInstance(settings)
// Update the `zigZag` on every bar.
zigZag.update()
//#endregion
The example code demonstrates how to create a ZigZag indicator with customizable settings. It:
1. Creates a Settings object with user-defined parameters
2. Instantiates a ZigZag object using these settings
3. Updates the ZigZag on each bar to detect new pivot points
4. Automatically draws lines and labels when pivots are detected
This approach provides maximum flexibility while maintaining readability and ease of use.

Percentage Based ZigZag█ OVERVIEW
The Percentage-Based ZigZag indicator is a custom technical analysis tool designed to highlight significant price reversals while filtering out market noise. Unlike many standard zigzag tools that rely solely on fixed price moves or generic trend-following methods, this indicator uses a configurable percentage threshold to dynamically determine meaningful pivot points. This approach not only adapts to different market conditions but also helps traders distinguish between minor fluctuations and truly significant trend shifts—whether scalping on shorter timeframes or analyzing longer-term trends.
█ KEY FEATURES & ORIGINALITY
Dynamic Pivot Detection
The indicator identifies pivot points by measuring the percentage change from the previous extreme (high or low). Only when this change exceeds a user-defined threshold is a new pivot recognized. This method ensures that only substantial moves are considered, making the indicator robust in volatile or noisy markets.
Enhanced ZigZag Visualization
By connecting significant highs and lows with a continuous line, the indicator creates a clear visual map of price swings. Each pivot point is labelled with the corresponding price and the percentage change from the previous pivot, providing immediate quantitative insight into the magnitude of the move.
Trend Reversal Projections
In addition to marking completed reversals, the script computes and displays potential future reversal points based on the current trend’s momentum. This forecasting element gives traders an advanced look at possible turning points, which can be particularly useful for short-term scalping strategies.
Customizable Visual Settings
Users can tailor the appearance by:
• Setting the percentage threshold to control sensitivity.
• Customizing colors for bullish (e.g., green) and bearish (e.g., red) reversals.
• Enabling optional background color changes that visually indicate the prevailing trend.
█ UNDERLYING METHODOLOGY & CALCULATIONS
Percentage-Based Filtering
The script continuously monitors price action and calculates the relative percentage change from the last identified pivot. A new pivot is confirmed only when the price moves a preset percentage away from this pivot, ensuring that minor fluctuations do not trigger false signals.
Pivot Point Logic
The indicator tracks the highest high and the lowest low since the last pivot. When the price reverses by the required percentage from these extremes, the algorithm:
1 — Labels the point as a significant high or low.
2 — Draws a connecting line from the previous pivot to the current one.
3 — Resets the extreme-tracking for detecting the next move.
Real-Time Reversal Estimation
Building on traditional zigzag methods, the script incorporates a projection calculation. By analyzing the current trend’s strength and recent percentage moves, it estimates where a future reversal might occur, offering traders actionable foresight.
█ HOW TO USE THE INDICATOR
1 — Apply the Indicator
• Add the Percentage-Based ZigZag indicator to your trading chart.
2 — Adjust Settings for Your Market
• Percentage Move – Set a threshold that matches your trading style:
- Lower values for sensitive, high-frequency analysis (ideal for scalping).
- Higher values for filtering out noise on longer timeframes.
• Visual Customization – Choose your preferred colors for bullish and bearish signals and enable background color changes for visual trend cues.
• Reversal Projection – Enable or disable the projection feature to display potential upcoming reversal points.
3 — Interpret the Signals
• ZigZag Lines – White lines trace significant high-to-low or low-to-high movements, visually connecting key swing points.
• Pivot Labels – Each pivot is annotated with the exact price level and percentage change, providing quantitative insight into market momentum.
• Trend Projections – When enabled, projected reversal levels offer insight into where the current trend might change.
4 — Integrate with Your Trading Strategy
• Use the indicator to identify support and resistance zones derived from significant pivots.
• Combine the quantitative data (percentage changes) with your risk management strategy to set optimal stop-loss and take-profit levels.
• Experiment with different threshold settings to adapt the indicator for various instruments or market conditions.
█ CONCLUSION
The Percentage-Based ZigZag indicator goes beyond traditional trend-following tools by filtering out market noise and providing clear, quantifiable insights into price action. With its percentage threshold for pivot detection and real-time reversal projections, this original methodology and customizable feature set offer traders a versatile edge for making informed trading decisions.

BullDozz Fibo ZigZagFibo ZigZag - Advanced Fibonacci Retracement Tool 🔥
📌 Overview
The Fibo ZigZag indicator is a powerful tool for trend structure analysis using the ZigZag pattern and Fibonacci retracement levels. It automatically identifies swing highs & lows, draws ZigZag lines, and overlays Fibonacci levels with price labels at the right end for better readability.
This indicator is designed for traders who use price action, trend reversal strategies, and support/resistance analysis.
🛠 Features
✅ Automatic ZigZag detection with customizable depth, deviation, and backstep
✅ Fibonacci retracement levels (0%, 23.6%, 38.2%, 50%, 61.8%, 100%, 161.8%, 261.8%, 423.6%)
✅ Price labels at Fibonacci levels (placed at the right end of the levels)
✅ Alerts for new swing highs & lows
✅ Customizable line colors, text colors, and label sizes
✅ Lightweight and optimized for fast performance
📊 How It Works
1️⃣ The script detects ZigZag structure points based on price swings
2️⃣ It connects recent highs & lows with a ZigZag line
3️⃣ Fibonacci retracement levels are calculated and drawn between the last two significant swing points
4️⃣ Each Fibo level is labeled with its percentage & exact price, placed at the right end for clarity
5️⃣ Alerts trigger automatically when a new swing high or low is detected
⚙ Customization Options
🔹 ZigZag Settings: Adjust Depth, Deviation, BackStep, and Leg length
🔹 Fibonacci Levels: Modify line colors, label text colors, and visibility
🔹 Alerts: Enable/disable trend change alerts
📈 Best Use Cases
🚀 Identifying Trend Reversals – Detect key turning points using Fibonacci levels
📉 Support & Resistance Trading – Use retracement levels as entry/exit points
📊 Swing Trading & Scalping – Combine ZigZag with price action for effective strategies
🔔 Alert-Based Trading – Get notified when new swing highs/lows form
🚀 How to Use
📌 Add the indicator to your chart
📌 Adjust the settings to match your trading strategy
📌 Use the Fibonacci levels & ZigZag lines to analyze trend direction & key price zones
📌 Wait for alerts or manually enter trades based on price reaction to Fibo levels
📢 Final Thoughts
The Fibo ZigZag is an essential tool for traders who rely on price action, trend reversals, and Fibonacci levels. Whether you're a beginner or a pro, this indicator helps you spot high-probability trading opportunities with ease.
⚡ Try it now & enhance your trading strategy! 🚀
💬 Let us know your feedback & suggestions in the comments! Happy trading! 📊🔥

Swing High/Low (ZigZag) [ChartPrime]Swing High/Low (ZigZag) Indicator
The Swing High/Low (ZigZag) Indicator is a versatile tool for identifying and visualizing price swings, swing highs, and swing lows. It dynamically plots levels for significant price points while connecting them with a ZigZag line, enabling traders to analyze market structure and trends with precision.
⯁ KEY FEATURES
Swing Highs and Lows Detection
Accurately detects and marks swing highs and lows, providing a clear structure of market movements.
Real-Time ZigZag Line
Connects swing points with a dynamic ZigZag line for a visual representation of price trends.
Customizable Swing Sensitivity
Swing length input allows traders to adjust the sensitivity of swing detection to match their preferred market conditions.
Swing Levels with Shadows
Option to display swing levels with extended shadows for better visibility and market analysis.
Broken Levels Marking
Tracks and visually updates levels as dashed lines when broken, providing insights into shifts in market structure.
Swing Direction Display
At the top-right corner, the indicator displays the current swing direction (up or down) with a directional arrow for quick reference.
Interactive Labels
Marks swing levels with labels, showing the price of swing highs and lows for added clarity.
Dynamic Market Structure Analysis
Automatically adjusts ZigZag lines and levels as the market evolves, ensuring real-time updates for accurate trading decisions.
⯁ HOW TO USE
Analyze Market Trends
Use the ZigZag line and swing levels to identify the overall direction and structure of the market.
Spot Significant Price Points
Swing highs and lows act as potential support and resistance levels for trading opportunities.
Adjust Swing Sensitivity
Modify the swing length setting to match your trading strategy, whether scalping, day trading, or swing trading.
Monitor Broken Levels
Use the dashed lines of broken levels to identify changes in market dynamics and potential breakout or breakdown zones.
Plan Entries and Exits
Leverage swing levels and direction to determine optimal entry, stop-loss, and take-profit points.
⯁ CONCLUSION
The Swing High/Low (ZigZag) Indicator is a powerful tool for traders seeking to visualize price swings and market structure. Its real-time updates, customizable settings, and dynamic swing direction make it an invaluable resource for technical analysis and decision-making.

Dragon Harmonic Pattern [TradingFinder] Dragon Detector🔵 Introduction
The Dragon Harmonic Pattern is one of the technical analysis tools that assists traders in identifying Potential Reversal Zones (PRZ). Resembling an "M" or "W" shape, this pattern is recognized in financial markets as a method for predicting bullish and bearish trends. By leveraging precise Fibonacci ratios and measuring price movements, traders can use this pattern to forecast market trends with high accuracy.
The Dragon Harmonic Pattern is built on the XABCD structure, where each point plays a significant role in shaping and forecasting price movements. Point X marks the beginning of the trend, representing the initial price movement. Point A indicates the first retracement, usually falling within the 0.380 to 0.620 range of the XA wave.
Next, point B signals the second retracement, which lies within 0.200 to 0.400 of the AB wave. Point C, acting as the hump of the pattern, is generally located within 0.800 to 1.100 of the XA wave. Finally, point D represents the endpoint of the pattern and the Potential Reversal Zone (PRZ), where the primary price reversal occurs.
In bullish scenarios, the Dragon Pattern indicates a reversal from a downtrend to an uptrend, where prices move upward from point D. Conversely, in bearish scenarios, prices decline after reaching point D. Accurate identification of this pattern through Fibonacci ratio analysis and PRZ examination can significantly increase the success rate of trades, enabling traders to adjust their strategies based on key market levels such as 0.618 or 1.100.
Due to its high accuracy in identifying Potential Reversal Zones (PRZ) and its alignment with Fibonacci ratios, the Dragon Harmonic Pattern is considered one of the most popular tools in technical analysis. Traders can use this pattern to pinpoint entry and exit points with greater confidence while minimizing trading risks.
Bullish :
Bearish :
🔵 How to Use
The Dragon Harmonic Pattern indicator helps traders identify bullish and bearish patterns in the market, allowing them to capitalize on available trading opportunities. By analyzing Fibonacci ratios and the XABCD structure, the indicator highlights Potential Reversal Zones (PRZ).
🟣 Bullish Dragon Pattern
In the Bullish Dragon Pattern, the price transitions from a downtrend to an uptrend after reaching point D. At this stage, points X, A, B, C, and D must be carefully identified.
Fibonacci ratios for these points are as follows: Point A should fall within 0.380 to 0.620 of the XA wave, point B within 0.200 to 0.400 of the AB wave, and point C within 0.800 to 1.100 of the XA wave.
When the price reaches point D, traders should look for bullish signals such as reversal candlesticks or increased trading volume to enter a buy position. The take-profit level can be set near the previous price high or based on the 1.272 Fibonacci ratio of the XA wave, while the stop-loss should be placed slightly below point D.
🟣 Bearish Dragon Pattern
In the Bearish Dragon Pattern, the price shifts from an uptrend to a downtrend after reaching point D. In this pattern, points X, A, B, C, and D must also be identified. Fibonacci ratios for these points are as follows: Point A should fall within 0.380 to 0.620 of the XA wave, point B within 0.200 to 0.400 of the AB wave, and point C within 0.800 to 1.100 of the XA wave.
Upon reaching point D, bearish signals such as reversal candlesticks or decreasing trading volume indicate the opportunity to enter a sell position. The take-profit level can be set near the previous price low or based on the 1.272 Fibonacci ratio of the XA wave, while the stop-loss should be placed slightly above point D.
By combining the Dragon Harmonic Pattern indicator with precise Fibonacci ratio analysis, traders can identify key opportunities while minimizing risks and improving their decision-making in both bullish and bearish market conditions.
🔵 Setting
🟣 Logical Setting
ZigZag Pivot Period : You can adjust the period so that the harmonic patterns are adjusted according to the pivot period you want. This factor is the most important parameter in pattern recognition.
Show Valid Forma t: If this parameter is on "On" mode, only patterns will be displayed that they have exact format and no noise can be seen in them. If "Off" is, the patterns displayed that maybe are noisy and do not exactly correspond to the original pattern.
Show Formation Last Pivot Confirm : if Turned on, you can see this ability of patterns when their last pivot is formed. If this feature is off, it will see the patterns as soon as they are formed. The advantage of this option being clear is less formation of fielded patterns, and it is accompanied by the latest pattern seeing and a sharp reduction in reward to risk.
Period of Formation Last Pivot : Using this parameter you can determine that the last pivot is based on Pivot period.
🟣 Genaral Setting
Show : Enter "On" to display the template and "Off" to not display the template.
Color : Enter the desired color to draw the pattern in this parameter.
LineWidth : You can enter the number 1 or numbers higher than one to adjust the thickness of the drawing lines. This number must be an integer and increases with increasing thickness.
LabelSize : You can adjust the size of the labels by using the "size.auto", "size.tiny", "size.smal", "size.normal", "size.large" or "size.huge" entries.
🟣 Alert Setting
Alert : On / Off
Message Frequency : This string parameter defines the announcement frequency. Choices include: "All" (activates the alert every time the function is called), "Once Per Bar" (activates the alert only on the first call within the bar), and "Once Per Bar Close" (the alert is activated only by a call at the last script execution of the real-time bar upon closing). The default setting is "Once per Bar".
Show Alert Time by Time Zone : The date, hour, and minute you receive in alert messages can be based on any time zone you choose. For example, if you want New York time, you should enter "UTC-4". This input is set to the time zone "UTC" by default.
🔵 Conclusion
The Dragon Harmonic Pattern is an advanced and practical technical analysis tool that aids traders in accurately predicting bullish and bearish trends by identifying Potential Reversal Zones (PRZ) and utilizing Fibonacci ratios. Built on the XABCD structure, this pattern stands out for its flexibility and precision in identifying price movements, making it a valuable resource among technical analysts. One of its key advantages is its compatibility with other technical tools such as trendlines, support and resistance levels, and Fibonacci retracements.
By using the Dragon Harmonic Pattern indicator, traders can accurately determine entry and exit points for their trades. The indicator analyzes key Fibonacci ratios—0.380 to 0.620, 0.200 to 0.400, and 0.800 to 1.100—to identify critical levels such as price highs and lows, offering precise trading strategies. In bullish scenarios, traders can profit from rising prices, while in bearish scenarios, they can capitalize on price declines.
In conclusion, the Dragon Harmonic Pattern is a highly reliable tool for identifying trading opportunities with exceptional accuracy. However, for optimal results, it is recommended to combine this pattern with other analytical tools and thoroughly assess market conditions. By utilizing this indicator, traders can reduce their trading risks while achieving higher profitability and confidence in their trading strategies.

Larry Williams: Market StructureLarry Williams' Three-Bar System of Highs and Lows: A Definition of Market Structure
Larry Williams developed a method of market structure analysis based on identifying local extrema using a sequence of three consecutive bars. This approach helps traders pinpoint significant turning points on the price chart.
Definition of Local Extrema:
Local High:
Consists of three bars where the middle bar has the highest high, while the lows of the bars on either side are lower than the low of the middle bar.
Local Low:
Consists of three bars where the middle bar has the lowest low, while the highs of the bars on either side are higher than the high of the middle bar.
This structure helps identify meaningful reversal points on the price chart.
Constructing the Zigzag Line:
Once the local highs and lows are determined, they are connected with lines to create a zigzag pattern.
This zigzag reflects the major price swings, filtering out minor fluctuations and market noise.
Medium-Term Market Structure:
By analyzing the sequence of local extrema, it is possible to determine the medium-term market trend:
Upward Structure: A sequence of higher highs and higher lows.
Downward Structure: A sequence of lower highs and lower lows.
Sideways Structure (Flat): Lack of a clear trend, where highs and lows remain approximately at the same level.
This method allows traders and analysts to better understand the current market phase and make informed trading decisions.
Built-in Indicator Feature:
The indicator includes a built-in functionality to display Intermediate Term Highs and Lows , which are defined by filtering short-term highs and lows as described in Larry Williams' methodology. This feature is enabled by default, ensuring traders can immediately visualize key levels for support, resistance, and trend assessment.
Quote from Larry Williams' Work on Intermediate Term Highs and Lows:
"Now, the most interesting part! Look, if we can identify a short-term high by defining it as a day with lower highs (excluding inside days) on both sides, we can take a giant leap forward and define an intermediate term high as any short-term high with lower short-term highs on both sides. But that’s not all, because we can take it even further and say that any intermediate term high with lower intermediate term highs on both sides—you see where I’m going—forms a long-term high.
For many years, I made a very good living simply by identifying these points as buy and sell signals. These points are the only valid support and resistance levels I’ve ever found. They are crucial, and the breach of these price levels provides important information about trend development and changes. Therefore, I use them for placing stop loss protection and entry methods into the market."
— Larry Williams
This insightful quote highlights the practical importance of identifying market highs and lows at different timeframes and underscores their role in effective trading strategies.

VD Zig Zag with SMAIntroduction
The VD Zig Zag with SMA indicator is a powerful tool designed to streamline technical analysis by combining Zig Zag swing lines with a Simple Moving Average (SMA). It offers traders a clear and intuitive way to analyze price trends, market structure, and potential reversals, all within a customizable framework.
Definition
The Zig Zag indicator is a trend-following tool that highlights significant price movements by filtering out smaller fluctuations. It visually connects swing highs and lows to reveal the underlying market structure. When paired with an SMA, it provides an additional layer of trend confirmation, helping traders align their strategies with market momentum.
Calculations
Zig Zag Logic:
Swing highs and lows are determined using a user-defined length parameter.
The highest and lowest points within the specified range are identified using the ta.highest() and ta.lowest() functions.
Zig Zag lines dynamically connect these swing points to visually map price movements.
SMA Logic:
The SMA is calculated using the closing prices over a user-defined period.
It smooths out price action to provide a clearer view of the prevailing trend.
The indicator allows traders to adjust the Zig Zag length and SMA period to suit their preferred trading timeframe and strategy.
Takeaways
Enhanced Trend Analysis: The Zig Zag lines clearly define the market's structural highs and lows, helping traders identify trends and reversals.
Customizable Parameters: Both the swing length and SMA period can be tailored for short-term or long-term trading strategies.
Visual Clarity: By filtering out noise, the indicator simplifies chart analysis and enables better decision-making.
Multi-Timeframe Support: Adapts seamlessly to the chart's timeframe, ensuring usability across all trading horizons.
Limitations
Lagging Nature: As with any indicator, the Zig Zag and SMA components are reactive and may lag during sudden price movements.
Sensitivity to Parameters: Improper parameter settings can lead to overfitting, where the indicator reacts too sensitively or misses significant trends.
Does Not Predict: This indicator identifies trends and structure but does not provide forward-looking predictions.
Summary
The VD Zig Zag with SMA indicator is a versatile and easy-to-use tool that combines the strengths of Zig Zag swing analysis and moving average trends. It helps traders filter market noise, visualize structural patterns, and confirm trends with greater confidence. While it comes with limitations inherent to all technical tools, its customizable features and multi-timeframe adaptability make it an excellent addition to any trader’s toolkit.
Additional Features
Have an idea or a feature you'd like to see added?
Feel free to reach out or share your suggestions here—I’m always open to updates!

Polygonal Pivot Bands [FXSMARTLAB]The Polygonal Pivot Bands highlights key price pivots, dynamic support and resistance levels, and recent price action on a trading chart. This indicator connects pivot highs and lows with a zigzag line, extends a real-time dashed line to the latest price point, and plots diagonal support/resistance levels that adapt to price movement. These elements together provide traders with a view of significant price zones and potential trend shifts.
Key Components of the Indicator
Pivots are calculated based on user-defined lengths, specifying how many bars on either side of a high or low are required to validate it as a pivot.
Adjustable left and right pivot lengths allow traders to control the sensitivity of pivot detection, with higher values resulting in fewer, more prominent pivots, and lower values increasing sensitivity to price changes.
Zigzag Line
The zigzag line connects consecutive pivot points, filtering out smaller fluctuations and emphasizing the broader direction of price movement.
Users can customize the line's color and thickness to match their preferences, helping them focus on larger trends and potential reversal points.
By linking pivot highs and lows, the zigzag pattern highlights the overall trend and potential points of reversal.
Real-Time Connector Line
A dashed line extends from the last confirmed pivot to the latest price point, providing a real-time, bar-by-bar update of the current price relative to the previous pivot.
This line does not project future price direction but maintains an up-to-date connection with the current price, showing the distance from the last pivot.
Its color and thickness are customizable for improved visibility on the chart.
Dynamic Support and Resistance Levels
The indicator plots dynamic support and resistanc e levels by connecting recent pivot highs and lows, resulting in lines that may appear diagonal rather than strictly horizontal.
These levels move in line with price action, adapting to the natural direction of trends, and offer visual cues where price may encounter support or resistance.
Colors and thickness of these lines can be set individually, allowing traders to adjust visibility according to their preferences.
Enabling these lines gives traders an ongoing reference for critical price boundaries that align more closely with the overall trend.

Alternative Shark Harmonic Pattern [TradingFinder] ALT Shark🔵 Introduction
The Alternative Shark harmonic pattern, similar to the original Shark harmonic pattern introduced by Scott Carney, is a powerful tool in technical analysis used to identify potential reversal zones (PRZ) in financial markets.
These harmonic patterns help traders spot key turning points in market trends by relying on specific Fibonacci ratios. The Alternative Shark pattern is particularly unique due to its distinct Fibonacci retracements within the PRZ, which differentiate it from the standard Shark pattern and provide traders with more precise entry and exit signals.
By focusing on harmonic patterns and utilizing tools like the Harmonic Pattern Indicator, traders can easily identify both the Shark and Alternative Shark patterns, making it easier to find PRZs and capture potential trend reversals. This enhanced detection of potential reversal zones allows for better trade optimization and improved risk management.
Incorporating the Alternative Shark pattern into your technical analysis strategy enables you to enhance your trading performance by identifying market reversals with greater accuracy, improving the timing of your trades, and reducing risks associated with sudden market shifts.
🟣 Understanding the Types of Alternative Shark Pattern
The Alternative Shark harmonic pattern, much like the original Shark pattern, forms at the end of price trends and is divided into two types: Bullish and Bearish Alternative Shark patterns.
Bullish Alternative Shark Pattern :
This pattern typically forms at the end of a downtrend, signaling a potential reversal into an uptrend. Traders can use this pattern to identify buy entry points. The image below illustrates the core components of the Bullish Alternative Shark Pattern.
Bearish Alternative Shark Pattern :
Conversely, the Bearish Alternative Shark Pattern appears at the end of an uptrend and signals a potential reversal to a downtrend. This variation allows traders to adjust their strategies for selling. The image below outlines the characteristics of the Bearish Alternative Shark Pattern.
🟣 Differences Between Shark and Alternative Shark Patterns
Although both patterns share similar structures and serve as tools for identifying price reversals, there is one key difference between them :
AB to XA Ratio : In the Shark pattern, the AB leg retraces between 1 and 2 of the XA leg, whereas in the Alternative Shark pattern, this retracement is reduced to 0.382 to 0.618 of the XA leg. This difference in the retracement ratio leads to slightly different trade signals and can affect the timing of entry and exit points.
Other ratios and reversal signals remain consistent between the two patterns, but this difference in the AB to XA ratio provides traders with more nuanced opportunities to optimize their trades.
🔵 How to Use
🟣 Trading with the Bullish Alternative Shark Pattern
The Bullish Alternative Shark Pattern functions similarly to the traditional Bullish Shark, acting as a reversal pattern that helps traders recognize the end of a downtrend and the beginning of an uptrend.
The main distinction lies in the reduced AB retracement, which can offer more refined entry signals. Once the pattern completes, traders can look to enter buy trades and place a stop-loss below the lowest point of the pattern for effective risk management.
🟣 Trading with the Bearish Alternative Shark Pattern
The Bearish Alternative Shark Pattern operates much like the Bearish Shark pattern but with the adjusted AB to XA ratio. This difference provides traders with unique entry points for sell trades. Once the pattern is fully identified, traders can enter short positions, placing a stop-loss above the highest point of the pattern to safeguard against market fluctuations.
🔵 Setting
🟣 Logical Setting
ZigZag Pivot Period : You can adjust the period so that the harmonic patterns are adjusted according to the pivot period you want. This factor is the most important parameter in pattern recognition.
Show Valid Forma t: If this parameter is on "On" mode, only patterns will be displayed that they have exact format and no noise can be seen in them. If "Off" is, the patterns displayed that maybe are noisy and do not exactly correspond to the original pattern.
Show Formation Last Pivot Confirm : if Turned on, you can see this ability of patterns when their last pivot is formed. If this feature is off, it will see the patterns as soon as they are formed. The advantage of this option being clear is less formation of fielded patterns, and it is accompanied by the latest pattern seeing and a sharp reduction in reward to risk.
Period of Formation Last Pivot : Using this parameter you can determine that the last pivot is based on Pivot period.
🟣 Genaral Setting
Show : Enter "On" to display the template and "Off" to not display the template.
Color : Enter the desired color to draw the pattern in this parameter.
LineWidth : You can enter the number 1 or numbers higher than one to adjust the thickness of the drawing lines. This number must be an integer and increases with increasing thickness.
LabelSize : You can adjust the size of the labels by using the "size.auto", "size.tiny", "size.smal", "size.normal", "size.large" or "size.huge" entries.
🟣 Alert Setting
Alert : On / Off
Message Frequency : This string parameter defines the announcement frequency. Choices include: "All" (activates the alert every time the function is called), "Once Per Bar" (activates the alert only on the first call within the bar), and "Once Per Bar Close" (the alert is activated only by a call at the last script execution of the real-time bar upon closing). The default setting is "Once per Bar".
Show Alert Time by Time Zone : The date, hour, and minute you receive in alert messages can be based on any time zone you choose. For example, if you want New York time, you should enter "UTC-4". This input is set to the time zone "UTC" by default.
🔵 Conclusion
The Alternative Shark harmonic pattern, despite its structural similarity to the traditional Shark pattern, introduces a key difference in the AB to XA ratio, making it a valuable addition to the trader’s toolkit. This subtle variation enables traders to pinpoint reversal points with greater accuracy and fine-tune their trading strategies.
As with any technical pattern, it is crucial to use the Alternative Shark pattern in combination with other technical indicators and strong risk management practices. Incorporating this pattern into a broader trading strategy can help traders enhance their ability to detect and capitalize on market reversals more effectively.

Absolute ZigZagThis ZigZag Indicator is a bit unique in it's kind.
It uses my own Absolute ZigZag Lib to calculate the pivots:
Instead of using percentages or looking more than 1 bar left or right, this Zigzag library calculates pivots by just looking at the current bar highs and lows and the ones of one bar earlier. This is a very fast and accurate way of calculating pivots.
The library also features a solution for bars that have both a higher high and a higher low like seen below.
You can also use your own colors for the labels and the lines:
You can also quickly select a one-colored theme without changing all colors at once:

Butterfly Harmonic Pattern [TradingFinder] Harmonic Detector🔵 Introduction
The Butterfly Harmonic Pattern is a sophisticated and highly regarded tool in technical analysis, utilized by traders to identify potential reversal points in the financial markets. This pattern is distinguished by its reliance on Fibonacci ratios and geometric configurations, which aid in predicting price movements with remarkable precision.
The origin of the Butterfly Harmonic Pattern can be traced back to the pioneering work of Bryce Gilmore, who is credited with discovering this pattern. Gilmore's extensive research and expertise in Fibonacci ratios laid the groundwork for the identification and application of this pattern in technical analysis.
The Butterfly pattern, like other harmonic patterns, is based on the principle that market movements are not random but follow specific structures and ratios.
The pattern is characterized by a distinct "M" shape in bullish scenarios and a "W" shape in bearish scenarios, each indicating a potential reversal point. These formations are identified by specific Fibonacci retracement and extension levels, making the Butterfly pattern a powerful tool for traders seeking to capitalize on market turning points.
The precise nature of the Butterfly pattern allows for the accurate prediction of target prices and the establishment of strategic entry and exit points, making it an indispensable component of a trader's analytical arsenal.
Bullish :
Bearish :
🔵 How to Use
Like other harmonic patterns, the Butterfly pattern is categorized based on how it forms at the end of an uptrend or downtrend. Unlike the Gartley and Bat patterns, the Butterfly pattern, similar to the Crab pattern, forms outside the wave 3 range at the end of a rally.
🟣 Types of Butterfly Harmonic Patterns
🟣 Bullish Butterfly Pattern
This pattern forms at the end of a downtrend and leads to a trend reversal from a downtrend to an uptrend.
🟣 Bearish Butterfly Pattern
In contrast to the Bullish Butterfly pattern, this pattern forms at the end of an uptrend and warns analysts of a trend reversal to a downtrend. In this case, traders are encouraged to shift their trading stance from buy trades to sell trades.
Advantages and Limitations of the Butterfly Pattern in Technical Analysis :
The Butterfly pattern is considered one of the precise and stable tools in financial market analysis. However, it is always important to pay special attention to the advantages and limitations of each pattern.
Here, we review the advantages and disadvantages of using the Butterfly harmonic pattern :
The main advantage of the Butterfly pattern is providing very accurate signals.
Using Fibonacci golden ratios and geometric rules, the Butterfly pattern identifies patterns accurately and systematically. (This high accuracy significantly helps investors in making trading decisions.)
Identifying this pattern requires expertise and experience in technical analysis.
Recognizing the Butterfly pattern might be complex for beginner traders. (Correct identification of the pattern necessitates mastery over geometric principles and Fibonacci ratios.)
The Butterfly harmonic pattern might issue false trading signals. (Traders usually combine the Butterfly pattern with other technical tools to confirm buy and sell signals.)
🔵 Setting
🟣 Logical Setting
ZigZag Pivot Period : You can adjust the period so that the harmonic patterns are adjusted according to the pivot period you want. This factor is the most important parameter in pattern recognition.
Show Valid Forma t: If this parameter is on "On" mode, only patterns will be displayed that they have exact format and no noise can be seen in them. If "Off" is, the patterns displayed that maybe are noisy and do not exactly correspond to the original pattern.
Show Formation Last Pivot Confirm : if Turned on, you can see this ability of patterns when their last pivot is formed. If this feature is off, it will see the patterns as soon as they are formed. The advantage of this option being clear is less formation of fielded patterns, and it is accompanied by the latest pattern seeing and a sharp reduction in reward to risk.
Period of Formation Last Pivot : Using this parameter you can determine that the last pivot is based on Pivot period.
🟣 Genaral Setting
Show : Enter "On" to display the template and "Off" to not display the template.
Color : Enter the desired color to draw the pattern in this parameter.
LineWidth : You can enter the number 1 or numbers higher than one to adjust the thickness of the drawing lines. This number must be an integer and increases with increasing thickness.
LabelSize : You can adjust the size of the labels by using the "size.auto", "size.tiny", "size.smal", "size.normal", "size.large" or "size.huge" entries.
🟣 Alert Setting
Alert : On / Off
Message Frequency : This string parameter defines the announcement frequency. Choices include: "All" (activates the alert every time the function is called), "Once Per Bar" (activates the alert only on the first call within the bar), and "Once Per Bar Close" (the alert is activated only by a call at the last script execution of the real-time bar upon closing). The default setting is "Once per Bar".
Show Alert Time by Time Zone : The date, hour, and minute you receive in alert messages can be based on any time zone you choose. For example, if you want New York time, you should enter "UTC-4". This input is set to the time zone "UTC" by default.

Sylvain Zig-Zag [MyTradingCoder]This Pine Script version of ZigZagHighLow is a faithful port of Sylvain Vervoort's original study, initially implemented in NinjaScript and later added to the thinkorswim standard library. This indicator identifies and connects swing points in price data, offering a clear visualization of market moves that exceed a specified threshold. Additionally, it now includes features for detecting and plotting support and resistance levels, enhancing its utility for technical analysis.
Overview
The Sylvain Zig-Zag study excels at highlighting significant price swings by plotting points where the price change, combined with volatility adjustments via the Average True Range (ATR), exceeds a user-defined percentage. It effectively smooths out minor fluctuations, allowing traders to focus on the primary market trends. This tool is particularly useful in identifying potential turning points, trends in price movements, and key support and resistance levels, making it a valuable addition to your technical analysis arsenal.
How It Works
The Sylvain Zig-Zag indicator works by detecting swing points in the price data and connecting them to form a zigzag pattern. A swing point is identified when the price moves a certain distance, defined by a combination of percentage change and ATR. This distance must be exceeded for a swing point to be plotted.
When the price moves upwards and exceeds the previous high by a specified percentage plus a factor of the ATR, a new high swing point is plotted. Conversely, a low swing point is plotted when the price moves downwards and exceeds the previous low by the same criteria. This ensures that only significant price moves are considered, filtering out minor fluctuations and providing a clear view of the overall market trend.
In addition to plotting zigzag lines, the indicator can now identify and draw support and resistance levels based on the detected swing points. These levels are crucial for identifying potential reversal areas and market structure.
Key Features
Swing Point Detection: Accurately identifies significant price swings by considering both percentage price change and volatility (via Average True Range).
Dynamic Support/Resistance: Automatically generates support and resistance lines based on the identified swing points, providing potential areas of price reversals.
Customizable Parameters: Tailor the indicator's sensitivity to your preferred trading style and market conditions. Adjust parameters like percentage reversal, ATR settings, and absolute/tick reversals.
Visual Clarity: Choose to display the ZigZag line, support/resistance levels, new trend icons, continuation icons, and even customize bar colors for easy visual analysis.
Trading Applications
Trend Identification: Easily visualize the prevailing market trend using the direction of the ZigZag line and support/resistance levels.
Entry/Exit Signals: Potential entry points can be identified when the price interacts with the dynamic support/resistance levels.
Stop-Loss Placement: Use recent swing points as logical places for setting stop-loss orders.
Profit Targets: Project potential price targets based on the distance between previous swing points.
Input Parameters
Several input parameters can be adjusted to customize the behavior of the Sylvain Zig-Zag indicator. These parameters allow traders to fine-tune the detection of swing points and support/resistance levels to better suit their trading strategy and the specific market conditions they are analyzing.
High Source and Low Source:
These inputs define the price points used for detecting high and low swing points, respectively. You can choose between high, low, open, or close prices for these calculations.
Percentage Reversal:
This input sets the minimum percentage change in price required for a swing to be detected. A higher percentage value will result in fewer but more significant swing points, while a lower value will detect more frequent, smaller swings.
Absolute Reversal:
This parameter allows for an additional fixed value to be added to the minimum price change and ATR change. This can be useful for increasing the distance between swing points in volatile markets.
ATR Length:
This input defines the period used for calculating the ATR, which is a measure of market volatility. A longer ATR period will smooth out the ATR calculation, while a shorter period will make it more sensitive to recent price changes.
ATR Multiplier:
This factor is applied to the ATR value to adjust the sensitivity of the swing point detection. A higher multiplier will increase the required price movement for a swing point to be plotted, reducing the number of detected swings.
Tick Reversal:
This input allows for an additional value in ticks to be added to the minimum price change and ATR change, providing further customization in the swing point detection process.
Support and Resistance:
Show S/R: Enable or disable the plotting of support and resistance levels.
Max S/R Levels: Set the maximum number of support and resistance levels to display.
S/R Line Width: Adjust the width of the support and resistance lines.
Visual Settings
The Sylvain Zig-Zag indicator also includes visual settings to enhance the clarity of the plotted swing points and trends. You can customize the color and width of the zigzag line, and enable icons to indicate new trends and continuation patterns. Additionally, the bars can be colored based on the detected trend, aiding in quick visual analysis.
Conclusion
This port of the ZigZagHighLow study from NinjaScript to Pine Script preserves the essence of Sylvain Vervoort’s methodology while adding new features for support and resistance. It provides traders with a powerful tool for technical analysis. The combination of price changes and ATR ensures that you have a robust and adaptable tool for identifying key market movements and structural levels. Customize the settings to match your trading style and gain a clearer picture of market trends, turning points, and support/resistance areas. Enjoy improved market analysis and more informed trading decisions with the Sylvain Zig-Zag indicator.

Harmonic Patterns Library [TradingFinder]🔵 Introduction
Harmonic patterns blend geometric shapes with Fibonacci numbers, making these numbers fundamental to understanding the patterns.
One person who has done a lot of research on harmonic patterns is Scott Carney.Scott Carney's research on harmonic patterns in technical analysis focuses on precise price structures based on Fibonacci ratios to identify market reversals.
Key patterns include the Gartley, Bat, Butterfly, and Crab, each with specific alignment criteria. These patterns help traders anticipate potential market turning points and make informed trading decisions, enhancing the predictability of technical analysis.
🟣 Understanding 5-Point Harmonic Patterns
In the current library version, you can easily draw and customize most XABCD patterns. These patterns often form M or W shapes, or a combination of both. By calculating the Fibonacci ratios between key points, you can estimate potential price movements.
All five-point patterns share a similar structure, differing only in line lengths and Fibonacci ratios. Learning one pattern simplifies understanding others.
🟣 Exploring the Gartley Pattern
The Gartley pattern appears in both bullish (M shape) and bearish (W shape) forms. In the bullish Gartley, point X is below point D, and point A surpasses point C. Point D marks the start of a strong upward trend, making it an optimal point to place a buy order.
The bearish Gartley mirrors the bullish pattern with inverted Fibonacci ratios. In this scenario, point D indicates the start of a significant price drop. Traders can place sell orders at this point and buy at lower prices for profit in two-way markets.
🟣 Analyzing the Butterfly Pattern
The Butterfly pattern also manifests in bullish (M shape) and bearish (W shape) forms. It resembles the Gartley pattern but with point D lower than point X in the bullish version.
The Butterfly pattern involves deeper price corrections than the Gartley, leading to more significant price fluctuations. Point D in the bullish Butterfly indicates the beginning of a sharp price rise, making it an entry point for buy orders.
The bearish Butterfly has inverted Fibonacci ratios, with point D marking the start of a sharp price decline, ideal for sell orders followed by buying at lower prices in two-way markets.
🟣 Insights into the Bat Pattern
The Bat pattern, appearing in bullish (M shape) and bearish (W shape) forms, is one of the most precise harmonic patterns. It closely resembles the Butterfly and Gartley patterns, differing mainly in Fibonacci levels.
The bearish Bat pattern shares the Fibonacci ratios with the bullish Bat, with an inverted structure. Point D in the bearish Bat marks the start of a significant price drop, suitable for sell orders followed by buying at lower prices for profit.
🟣 The Crab Pattern Explained
The Crab pattern, found in both bullish (M shape) and bearish (W shape) forms, is highly favored by analysts. Discovered in 2000, the Crab pattern features a larger final wave correction compared to other harmonic patterns.
The bearish Crab shares Fibonacci ratios with the bullish version but in an inverted form. Point D in the bearish Crab signifies the start of a sharp price decline, making it an ideal point for sell orders followed by buying at lower prices for profitable trades.
🟣 Understanding the Shark Pattern
The Shark pattern appears in bullish (M shape) and bearish (W shape) forms. It differs from previous patterns as point C in the bullish Shark surpasses point A, with unique level measurements.
The bearish Shark pattern mirrors the Fibonacci ratios of the bullish Shark but is inverted. Point D in the bearish Shark indicates the start of a sharp price drop, ideal for placing sell orders and buying at lower prices to capitalize on the pattern.
🟣 The Cypher Pattern Overview
The Cypher pattern is another that appears in both bullish (M shape) and bearish (W shape) forms. It resembles the Shark pattern, with point C in the bullish Cypher extending beyond point A, and point D forming within the XA line.
The bearish Cypher shares the Fibonacci ratios with the bullish Cypher but in an inverted structure. Point D in the bearish Cypher marks the start of a significant price drop, perfect for sell orders followed by buying at lower prices.
🟣 Introducing the Nen-Star Pattern
The Nen-Star pattern appears in both bullish (M shape) and bearish (W shape) forms. In the bullish Nen-Star, point C extends beyond point A, and point D, the final point, forms outside the XA line, making CD the longest wave.
The bearish Nen-Star has inverted Fibonacci ratios, with point D indicating the start of a significant price drop. Traders can place sell orders at point D and buy at lower prices to profit from this pattern in two-way markets.
The 5-point harmonic patterns, commonly referred to as XABCD patterns, are specific geometric price structures identified in financial markets. These patterns are used by traders to predict potential price movements based on historical price data and Fibonacci retracement levels.
Here are the main 5-point harmonic patterns :
Gartley Pattern
Anti-Gartley Pattern
Bat Pattern
Anti-Bat Pattern
Alternate Bat Pattern
Butterfly Pattern
Anti-Butterfly Pattern
Crab Pattern
Anti-Crab Pattern
Deep Crab Pattern
Shark Pattern
Anti- Shark Pattern
Anti Alternate Shark Pattern
Cypher Pattern
Anti-Cypher Pattern
🔵 How to Use
To add "Order Block Refiner Library", you must first add the following code to your script.
import TFlab/Harmonic_Chart_Pattern_Library_TradingFinder/1 as HP
🟣 Parameters
XABCD(Name, Type, Show, Color, LineWidth, LabelSize, ShVF, FLPC, FLPCPeriod, Pivot, ABXAmin, ABXAmax, BCABmin, BCABmax, CDBCmin, CDBCmax, CDXAmin, CDXAmax) =>
Parameters:
Name (string)
Type (string)
Show (bool)
Color (color)
LineWidth (int)
LabelSize (string)
ShVF (bool)
FLPC (bool)
FLPCPeriod (int)
Pivot (int)
ABXAmin (float)
ABXAmax (float)
BCABmin (float)
BCABmax (float)
CDBCmin (float)
CDBCmax (float)
CDXAmin (float)
CDXAmax (float)
🟣 Genaral Parameters
Name : The name of the pattern.
Type: Enter "Bullish" to draw a Bullish pattern and "Bearish" to draw an Bearish pattern.
Show : Enter "true" to display the template and "false" to not display the template.
Color : Enter the desired color to draw the pattern in this parameter.
LineWidth : You can enter the number 1 or numbers higher than one to adjust the thickness of the drawing lines. This number must be an integer and increases with increasing thickness.
LabelSize : You can adjust the size of the labels by using the "size.auto", "size.tiny", "size.smal", "size.normal", "size.large" or "size.huge" entries.
🟣 Logical Parameters
ShVF : If this parameter is on "true" mode, only patterns will be displayed that they have exact format and no noise can be seen in them. If "false" is, the patterns displayed that maybe are noisy and do not exactly correspond to the original pattern.
FLPC : if Turned on, you can see this ability of patterns when their last pivot is formed. If this feature is off, it will see the patterns as soon as they are formed. The advantage of this option being clear is less formation of fielded patterns, and it is accompanied by the lateest pattern seeing and a sharp reduction in reward to risk.
FLPCPeriod : Using this parameter you can determine that the last pivot is based on Pivot period.
Pivot : You need to determine the period of the zigzag indicator. This factor is the most important parameter in pattern recognition.
ABXAmin : Minimum retracement of "AB" line compared to "XA" line.
ABXAmax : Maximum retracement of "AB" line compared to "XA" line.
BCABmin : Minimum retracement of "BC" line compared to "AB" line.
BCABmax : Maximum retracement of "BC" line compared to "AB" line.
CDBCmin : Minimum retracement of "CD" line compared to "BC" line.
CDBCmax : Maximum retracement of "CD" line compared to "BC" line.
CDXAmin : Minimum retracement of "CD" line compared to "XA" line.
CDXAmax : Maximum retracement of "CD" line compared to "XA" line.
🟣 Function Outputs
This library has two outputs. The first output is related to the alert of the formation of a new pattern. And the second output is related to the formation of the candlestick pattern and you can draw it using the "plotshape" tool.
Candle Confirmation Logic :
Example :
import TFlab/Harmonic_Chart_Pattern_Library_TradingFinder/1 as HP
PP = input.int(3, 'ZigZag Pivot Period')
ShowBull = input.bool(true, 'Show Bullish Pattern')
ShowBear = input.bool(true, 'Show Bearish Pattern')
ColorBull = input.color(#0609bb, 'Color Bullish Pattern')
ColorBear = input.color(#0609bb, 'Color Bearish Pattern')
LineWidth = input.int(1 , 'Width Line')
LabelSize = input.string(size.small , 'Label size' , options = )
ShVF = input.bool(false , 'Show Valid Format')
FLPC = input.bool(false , 'Show Formation Last Pivot Confirm')
FLPCPeriod =input.int(2, 'Period of Formation Last Pivot')
//Call function
= HP.XABCD('Bullish Bat', 'Bullish', ShowBull, ColorBull , LineWidth, LabelSize ,ShVF, FLPC, FLPCPeriod, PP, 0.382, 0.50, 0.382, 0.886, 1.618, 2.618, 0.85, 0.9)
= HP.XABCD('Bearish Bat', 'Bearish', ShowBear, ColorBear , LineWidth, LabelSize ,ShVF, FLPC, FLPCPeriod, PP, 0.382, 0.50, 0.382, 0.886, 1.618, 2.618, 0.85, 0.9)
//Alert
if BearAlert
alert('Bearish Harmonic')
if BullAlert
alert('Bulish Harmonic')
//CandleStick Confirm
plotshape(BearCandleConfirm, style = shape.arrowdown, color = color.red)
plotshape(BullCandleConfirm, style = shape.arrowup, color = color.green, location = location.belowbar )

Market Structures + ZigZag [TradingFinder] CHoCH/BOS - MSS/MSB🟣 Introduction
🔵 Market Structure
Grasping market structure entails examining market behavior. Essentially, market structure refers to the formation and progression of the market within its trends.
Market structures are generally fractal and nested, leading us to classify them into internal (minor) and external (major) structures. There are several definitions of market structure, with differing perspectives such as Smart Money and ICT offering their own interpretations.
🔵 Zig Zag
The Zigzag indicator is a lagging tool that identifies points on a price chart where significant changes occur compared to the previous wave. By connecting these points, it helps traders detect trends.
This indicator minimizes random price fluctuations, aiming to clarify the primary price trend.
Pivots are points on a price chart where the direction changes. Also known as reversal points, pivots form when supply and demand forces overpower one another.
There are various types of technical analysis pivots, which can be divided into two categories: minor pivots and major pivots, each with distinct significance in analysis.
Major Pivot : These pivots signify substantial changes in the chart's direction and occur at the end of trends. Analysts focusing on primary analysis prioritize major pivot points. In fact, most technical analysis tools are evaluated and based on major pivots.
Minor Pivot : These pivots highlight smaller, subsidiary points and directions, appearing at the end of corrections. Analysts who focus on minor pivots represent small trends. It's important to note that minor pivots are not suitable for use in primary technical tools.
Identifying Minor and Major Pivots :
Minor pivots are formed between two major pivots and do not break the opposing major pivot. (Internal Pivot)
Major pivots are those that either successfully break the opposing pivot or move beyond the previous pivot of the same type. (External Pivot)
🟣 How to Use
🔵 Identifying Break of Structure (BOS)
In a given trend, such as a downtrend, a Break of Structure occurs when the price drops below the previous low and forms a new low (LL). In an uptrend, a BOS (MSB) happens when the price rises and exceeds the last high.
To confirm a trend, at least one BOS is required. The break above or below the previous high or low must be validated by the closing of at least one candle beyond that level.
🔵 Identifying Change of Character (CHOCH)
Change of Character (CHOCH) is an essential concept in market structure analysis, indicating a trend change. In other words, a trend concludes with a CHOCH (MSS). For example, in a downtrend, the price declines with BOS.
While BOS highlights the trend's strength, a CHOCH occurs when the price rises and surpasses the last high, signaling a transition from a downtrend to an uptrend.
This does not imply immediately entering a buy trade; instead, it is prudent to wait for a BOS in the upward direction to confirm the uptrend.
Unlike BOS, confirming a CHOCH does not require a candle to close; simply breaking above or below the previous high or low with the candle's wick is sufficient. The following examples illustrate bearish and bullish CHOCH.
Terms :
Market Structure Shift = MSS
Market Structure Break = MSB
🔵 Zig Zag
Based on identifying pivots and drawing zigzag lines, you can have different uses of this indicator.
Including :
Identifying pivot types along with major and minor recognition.
Identifying internal and external breakouts.
Identifying support and resistance levels.
Identifying Elliott Waves.
Identifying classic patterns.
Identifying pivots with higher validity.
Identifying trends and range areas.
🟣 Settings
Pivot Period Market Structure and ZigZag Line: Using this input, you can determine the pivot period for identifying swings.
Through the settings, you can customize the display, visibility, and color of each line as desired.

Volatility_ZigZag_LibraryThis is a Pine Script library for the public indicator "Volatility ZigZag" by brettkind. For further description, please refer to the information available on the original indicator page.
Library "Volatility_ZigZag_Library"
getValues_andStyling_VolatilityZigZag_byBrettkind(hl_src, SOURCE, length, min_dev_input, stdev_fctr, ZigZag, zz_color, zz_width, zz_devline, zz_points, zz_alert_sign, ZZ_Label, ZZ_Label_clr, rev_text, zz_bars_text, pcabs_text, avg_pcabs_text, pcrel_text, avg_pcrel_text, vol_text, avg_vol_text, input_currency)
Parameters:
hl_src (bool)
SOURCE (float)
length (int)
min_dev_input (float)
stdev_fctr (float)
ZigZag (bool)
zz_color (color)
zz_width (int)
zz_devline (bool)
zz_points (bool)
zz_alert_sign (bool)
ZZ_Label (bool)
ZZ_Label_clr (color)
rev_text (bool)
zz_bars_text (bool)
pcabs_text (bool)
avg_pcabs_text (bool)
pcrel_text (bool)
avg_pcrel_text (bool)
vol_text (bool)
avg_vol_text (bool)
input_currency (string)
getStatisticTable_VolatilityZigZag_byBrettkind(x1, Y1_array, draw_tbl)
Parameters:
x1 (int)
Y1_array (array)
draw_tbl (bool)
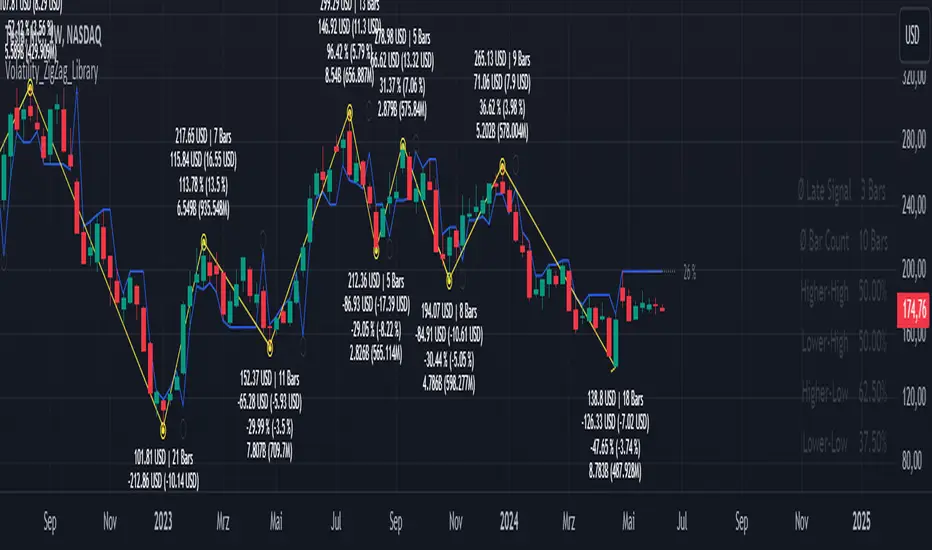
ZigZag Smart Trend [TradingFinder] Major & Minor Structured Wave🔵 Introduction
🟣 Zigzag
Zigzag is a lagging indicator; this indicator identifies points on a price chart that have more significant changes than its previous wave and then by connecting these lines to each other, it assists traders in trend detection.
This indicator reduces random price fluctuations and attempts to make the primary price trend clearer.
🟣 Pivot
Pivots are points where the price chart changes direction. Pivots, also called reversal points, form when supply and demand forces dominate one another.
Different types of technical analysis pivots can be introduced into two categories, minor pivots, and major pivots, each of which has a specific meaning in analysis.
Major Pivot : These pivots actually indicate major changes in the direction of the chart and occur at the end of trends. Analysts seeking to reach the primary analysis focus more on major pivot points. In fact, most technical analysis tools are examined and determined based on major pivots.
Minor Pivot : This type of pivot focuses more on small and subsidiary points and directions. Therefore, it occurs at the end of corrections. Analysts focusing on minor pivots represent small trends, and it should be noted that minor pivots are not suitable for use in primary technical tools.
How to identify minor and major pivots :
Minor pivots are pivots formed between two major pivots and fail to break the opposite major pivot.
Major pivots are pivots that have either successfully broken the opposite pivot or have moved more than the previous pivot of the same type.
🔵 How to use
Based on identifying pivots and drawing zigzag lines, you can have various uses for this indicator.
Identifying support and resistance levels :
Identifying Elliott Waves :
Identifying classic patterns :
Identifying pivots with higher validity :
Identifying internal and external breakouts :
Identifying trends and range areas :
Identifying pivot types along with major and minor recognition :
MHH : Major Higher High
MLH : Major Lower High
MLL : Major Lower Low
MHL : Major Higher Low
mHH : Minor Higher High
mLH : Minor Lower High
mLL : Minor Lower Low
mHL : Minor Higher Low
🔵 Settings
Pivot Period Zigzag Line : Using this input, you can determine the pivot period for identifying zigzag swings.
Show Zigzag Line : To show or not to show the zigzag line.
Zigzag Line Color : Change the color of the zigzag line.
Zigzag Line Style : Change the Style of the zigzag line.
Zigzag Line Width : Change the Width of the zigzag line.
Show Label : To show or not to show Pivot Type.
Color Label : Change the color of the Pivot Type Label.

ZigZag Library [TradingFinder]🔵 Introduction
The "Zig Zag" indicator is an analytical tool that emerges from pricing changes. Essentially, it connects consecutive high and low points in an oscillatory manner. This method helps decipher price changes and can also be useful in identifying traditional patterns.
By sifting through partial price changes, "Zig Zag" can effectively pinpoint price fluctuations within defined time intervals.
🔵 Key Features
1. Drawing the Zig Zag based on Pivot points :
The algorithm is based on pivots that operate consecutively and alternately (switch between high and low swing). In this way, zigzag lines are connected from a swing high to a swing low and from a swing low to a swing high.
Also, with a very low probability, it is possible to have both low pivots and high pivots in one candle. In these cases, the algorithm tries to make the best decision to make the most suitable choice.
You can control what period these decisions are based on through the "PiPe" parameter.
2.Naming and labeling each pivot based on its position as "Higher High" (HH), "Lower Low" (LL), "Higher Low" (HL), and "Lower High" (LH).
Additionally, classic patterns such as HH, LH, LL, and HL can be recognized. All traders analyzing financial markets using classic patterns and Elliot Waves can benefit from the "zigzag" indicator to facilitate their analysis.
" HH ": When the price is higher than the previous peak (Higher High).
" HL ": When the price is higher than the previous low (Higher Low).
" LH ": When the price is lower than the previous peak (Lower High).
" LL ": When the price is lower than the previous low (Lower Low).
🔵 How to Use
First, you can add the library to your code as shown in the example below.
import TFlab/ZigZagLibrary_TradingFinder/1 as ZZ
Function "ZigZag" Parameters :
🟣 Logical Parameters
1. HIGH : You should place the "high" value here. High is a float variable.
2. LOW : You should place the "low" value here. Low is a float variable.
3. BAR_INDEX : You should place the "bar_index" value here. Bar_index is an integer variable.
4. PiPe : The desired pivot period for plotting Zig Zag is placed in this parameter. For example, if you intend to draw a Zig Zag with a Swing Period of 5, you should input 5.
PiPe is an integer variable.
Important :
Apart from the "PiPe" indicator, which is part of the customization capabilities of this indicator, you can create a multi-time frame mode for the indicator using 3 parameters "High", "Low" and "BAR_INDEX". In this way, instead of the data of the current time frame, use the data of other time frames.
Note that it is better to use the current time frame data, because using the multi-time frame mode is associated with challenges that may cause bugs in your code.
🟣 Setting Parameters
5. SHOW_LINE : It's a boolean variable. When true, the Zig Zag line is displayed, and when false, the Zig Zag line display is disabled.
6. STYLE_LINE : In this variable, you can determine the style of the Zig Zag line. You can input one of the 3 options: line.style_solid, line.style_dotted, line.style_dashed. STYLE_LINE is a constant string variable.
7. COLOR_LINE : This variable takes the input of the line color.
8. WIDTH_LINE : The input for this variable is a number from 1 to 3, which is used to adjust the thickness of the line that draws the Zig Zag. WIDTH_LINE is an integer variable.
9. SHOW_LABEL : It's a boolean variable. When true, labels are displayed, and when false, label display is disabled.
10. COLOR_LABEL : The color of the labels is set in this variable.
11. SIZE_LABEL : The size of the labels is set in this variable. You should input one of the following options: size.auto, size.tiny, size.small, size.normal, size.large, size.huge.
12. Show_Support : It's a boolean variable that, when true, plots the last support line, and when false, disables its plotting.
13. Show_Resistance : It's a boolean variable that, when true, plots the last resistance line, and when false, disables its plotting.
Suggestion :
You can use the following code snippet to import Zig Zag into your code for time efficiency.
//import Library
import TFlab/ZigZagLibrary_TradingFinder/1 as ZZ
// Input and Setting
// Zig Zag Line
ShZ = input.bool(true , 'Show Zig Zag Line', group = 'Zig Zag') //Show Zig Zag
PPZ = input.int(5 ,'Pivot Period Zig Zag Line' , group = 'Zig Zag') //Pivot Period Zig Zag
ZLS = input.string(line.style_dashed , 'Zig Zag Line Style' , options = , group = 'Zig Zag' )
//Zig Zag Line Style
ZLC = input.color(color.rgb(0, 0, 0) , 'Zig Zag Line Color' , group = 'Zig Zag') //Zig Zag Line Color
ZLW = input.int(1 , 'Zig Zag Line Width' , group = 'Zig Zag')//Zig Zag Line Width
// Label
ShL = input.bool(true , 'Label', group = 'Label') //Show Label
LC = input.color(color.rgb(0, 0, 0) , 'Label Color' , group = 'Label')//Label Color
LS = input.string(size.tiny , 'Label size' , options = , group = 'Label' )//Label size
Show_Support= input.bool(false, 'Show Last Support',
tooltip = 'Last Support' , group = 'Support and Resistance')
Show_Resistance = input.bool(false, 'Show Last Resistance',
tooltip = 'Last Resistance' , group = 'Support and Resistance')
//Call Function
ZZ.ZigZag(high ,low ,bar_index ,PPZ , ShZ ,ZLS , ZLC, ZLW ,ShL , LC , LS , Show_Support , Show_Resistance )

ZigZag LibraryThis is yet another ZigZag library.
🔵 Key Features
1. Lightning-Fast Performance : Optimized code ensures minimal lag and swift chart updates.
2. Real-Time Swing Detection : No more waiting for swings to finalize! This library continuously identifies the latest swing formation.
3. Amplitude-Aware : Discover significant swings earlier, even if they haven't reached the standard bar length.
4. Customizable Visualization : Draw ZigZag on-demand using polylines for a tailored analysis experience.
Stay tuned for more features as this library is being continuously enhanced. For the latest updates, please refer to the release information.
🔵 API
// Import this library. Remember to check the latest version of this library and replace the version number below.
import algotraderdev/zigzag/1 as zz
// Initialize the ZigZag instance.
var zz.ZigZag zig = zz.ZigZag.new().init(
zz.Settings.new(
swingLen = 5,
lineColor = color.blue,
lineStyle = line.style_solid,
lineWidth = 1))
// Analyze the ZigZag using the latest bar's data.
zig.tick()
// Draw the ZigZag.
if barstate.islast
zig.draw()
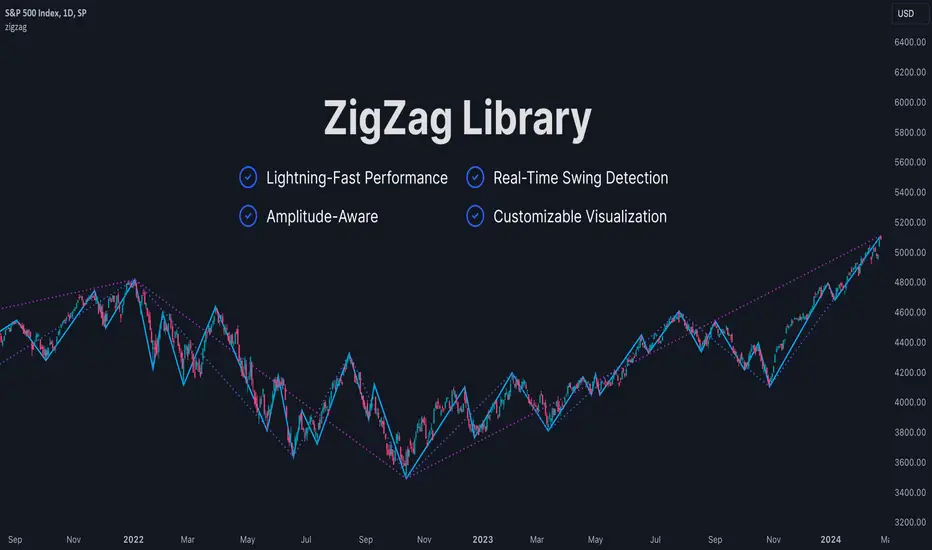
ZigZag Multi [TradingFinder] Trend & Wave Lines - Structures🔵 Introduction
"Zigzag" is an indicator that forms based on price changes. Essentially, the function of this indicator is to connect consecutive and alternating High and Low pivots. This pattern assists in analyzing price changes and can also be used to identify classic patterns. "Zigzag" is an analytical tool that, by filtering partial price movements based on the specified period, can identify price waves across different time frames (short or long term).
🔵 Reason for Creation
The combination of "short term zigzag" and "long term zigzag" enhances accuracy and reduces analysis time. In a time frame, "long term zigzag" represents the main trend, while "short term zigzag" depicts short-term waves.
🔵 How to Use
After selecting the desired time frame and adding "zigzag" to the chart, begin utilization. Keep in mind to identify the main market trend from "long term zigzag" and the minor waves from "short term zigzag".
🟣 Important: Additionally, classic patterns such as HH, LH, LL, and HL can be recognized. All traders analyzing financial markets using classic patterns and Elliot Waves can benefit from the "zigzag" indicator to facilitate their analysis.
🔵 Settings
Short term zigzag : In this section, you can adjust settings such as time frame range, display mode, color, and line width of the zigzag lines.
Short term label : This section allows you to activate or deactivate the display of zigzag labels according to your needs. You can also customize their color and size.
Long term zigzag : Here, you can adjust settings for time frame range, display mode, color, and line width of zigzag lines.
Long term label : Similar to short term label settings.
The recommended time frame for "long term zigzag" is between 9 to 15, and for "short term zigzag" is between 3 to 5.
🟣 Important Notes :
Considering the different behaviors of financial markets and various time frames, it is recommended to experiment with different time frame settings when using "zigzag" to find the best settings for each symbol and time frame, thereby preventing potential errors.
🟣 Terminology Explanations :
"HH": When the price is higher than the previous peak (Higher High).
"HL": When the price is higher than the previous low (Higher Low).
"LH": When the price is lower than the previous peak (Lower High).
"LL": When the price is lower than the previous low (Lower Low).

Zigzag Fibonacci Golden Zone [UAlgo]🔶 Description:
The "Zigzag Fibonacci Golden Zone" aims to identify potential trend pullback points by utilizing a combination of zigzag patterns and Fibonacci "Golden Zone (0.618 - 0.786)" retracement levels. It plots zigzag lines on the price chart, highlighting significant swing highs and swing lows, and overlays Fibonacci retracement levels to indicate potential support and resistance zones. Additionally, it provides options to display buy and sell signals based on specific criteria.
🔶 Key Features:
Zigzag Lines: The indicator plots zigzag lines on the price chart, marking significant swing highs and swing lows. These lines help traders visualize the direction and magnitude of price swings.
Fibonacci Retracement Levels: The indicator overlays Fibonacci retracement levels on the chart, indicating potential support and resistance levels. These levels are derived from the Fibonacci sequence and are commonly used by traders to identify reversal points.
Fibonacci occurs again when a new zigzag low or high is created :
Before new zigzag low pivot appears,
After new Zigzag low pivot appears,
As you see new fibonacci created after new pivot found also price bounced from retracement zone.
Customization Options: Traders can customize various parameters of the indicator, such as the length of the zigzag pattern, color preferences for different elements, and visibility of price labels and buy/sell signals.
Buy/Sell Signals: The indicator generates buy and sell signals based on predefined criteria, such as price movements relative to Fibonacci levels and other market conditions. These signals can help traders identify potential entry and exit points in the market.
Example :
Disclaimer :
Please note that trading involves significant risk, and past performance is not indicative of future results. The "Zigzag Fibonacci Golden Zone" indicator is provided for informational purposes only and should not be considered financial advice. Traders should conduct their own research and analysis before making any investment decisions. Additionally, the indicator's performance may vary depending on market conditions and other factors. Users are encouraged to use the indicator as part of a comprehensive trading strategy and to exercise caution when trading in the financial markets.
