OPEN-SOURCE SCRIPT
Linear Regression Volume Profile [ChartPrime]

LR VolumeProfile [ChartPrime]
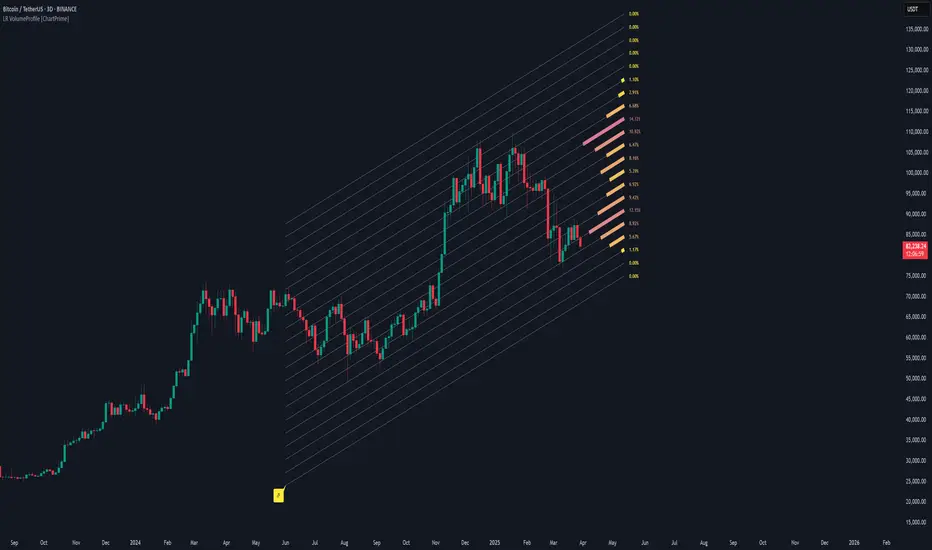
This indicator combines a Linear Regression channel with a dynamic volume profile, giving traders a powerful way to visualize both directional price movement and volume concentration along the trend.
⯁ KEY FEATURES
⯁ HOW TO USE
⯁ CONCLUSION
LR Volume Profile [ChartPrime] is a precision tool for traders who want to merge trend analysis with volume insight. By integrating linear regression trendlines with a clean and readable volume distribution, this indicator helps traders find price levels that matter the most—backed by volume, trend, and structure. Whether you're spotting high-volume nodes or gauging directional flow, this toolkit elevates your decision-making process with clarity and depth.
This indicator combines a Linear Regression channel with a dynamic volume profile, giving traders a powerful way to visualize both directional price movement and volume concentration along the trend.
⯁ KEY FEATURES
- Linear Regression Channel: Draws a statistically fitted channel to track the market trend over a defined period.
- Volume Profile Overlay: Splits the channel into multiple horizontal levels and calculates volume traded within each level.
- Percentage-Based Labels: Displays each level's share of total volume as a percentage, offering a clean way to see high and low volume zones.
- Gradient Bars: Profile bars are colored using a gradient scale from yellow (low volume) to red (high volume), making it easy to identify key interest areas.
- Adjustable Profile Width and Resolution: Users can change the width of profile bars and spacing between levels.
- Channel Direction Indicator: An arrow inside a floating label shows the direction (up or down) of the current linear regression slope.
- Level Style Customization: Choose from solid, dashed, or dotted lines for visual preference.
⯁ HOW TO USE
- Use the Linear Regression channel to determine the dominant price trend direction.
- Analyze the volume bars to spot key levels where the majority of volume was traded—these act as potential support/resistance zones.
- Pay attention to the largest profile bars—these often mark zones of institutional interest or price consolidation.
- The arrow label helps quickly assess whether the trend is upward or downward.
- Combine this tool with price action or momentum indicators to build high-confidence trading setups.
⯁ CONCLUSION
LR Volume Profile [ChartPrime] is a precision tool for traders who want to merge trend analysis with volume insight. By integrating linear regression trendlines with a clean and readable volume distribution, this indicator helps traders find price levels that matter the most—backed by volume, trend, and structure. Whether you're spotting high-volume nodes or gauging directional flow, this toolkit elevates your decision-making process with clarity and depth.
Script open-source
Nello spirito di TradingView, l'autore di questo script lo ha reso open source, in modo che i trader possano esaminarne e verificarne la funzionalità. Complimenti all'autore! Sebbene sia possibile utilizzarlo gratuitamente, ricordiamo che la ripubblicazione del codice è soggetta al nostro Regolamento.
Declinazione di responsabilità
Le informazioni e le pubblicazioni non sono intese come, e non costituiscono, consulenza o raccomandazioni finanziarie, di investimento, di trading o di altro tipo fornite o approvate da TradingView. Per ulteriori informazioni, consultare i Termini di utilizzo.