OPEN-SOURCE SCRIPT
Aggiornato Morning Break Out
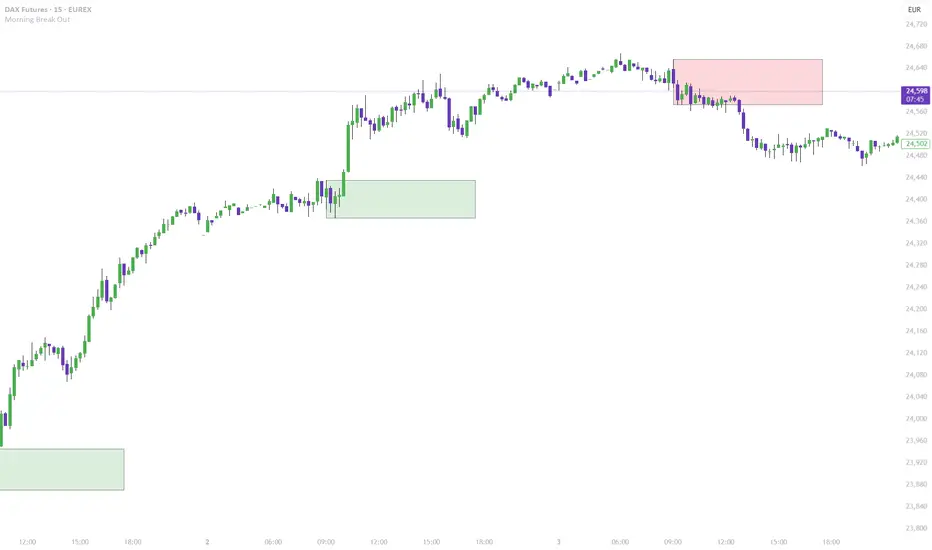
This indicator visualizes a classic morning breakout setup for the DAX and other European markets. The first hour often sets the tone for the trading day — this tool helps you identify that visually and react accordingly.
🔍 How It Works:
Box Range Calculation:
The high and low between 09:00 and 10:00 define the top and bottom of the box.
Color Logic:
Green: Price breaks above the box after 10:00 → bullish breakout
Red: Price breaks below the box after 10:00 → bearish breakout
Gray: No breakout → neutral phase
📈 Use Cases:
Identify breakout setups visually
Ideal for intraday traders and momentum strategies
Combine with volume or trend filters
⚙️ Notes:
Recommended for timeframes 1-minute and above
Uses the chart’s local timezone (e.g. CET/CEST for XETRA/DAX)
Works on all instruments with data before 09:00 — perfect for DAX, EuroStoxx, futures, FX, CFDs, etc.
Note di rilascio
This indicator visualizes a classic morning breakout setup for the DAX and other European markets. The first hour often sets the tone for the trading day — this tool helps you identify that visually and react accordingly.🔍 How It Works:
Box Range Calculation:
The high and low between 09:00 and 10:00 define the top and bottom of the box.
Color Logic:
Green: Price breaks above the box after 10:00 → bullish breakout
Red: Price breaks below the box after 10:00 → bearish breakout
Gray: No breakout → neutral phase
📈 Use Cases:
Identify breakout setups visually
Ideal for intraday traders and momentum strategies
Combine with volume or trend filters
⚙️ Notes:
Recommended for timeframes 1-minute and above
Uses the chart’s local timezone (e.g. CET/CEST for XETRA/DAX)
Works on all instruments with data before 09:00 — perfect for DAX, EuroStoxx, futures, FX, CFDs, etc.
Script open-source
Nello spirito di TradingView, l'autore di questo script lo ha reso open source, in modo che i trader possano esaminarne e verificarne la funzionalità. Complimenti all'autore! Sebbene sia possibile utilizzarlo gratuitamente, ricordiamo che la ripubblicazione del codice è soggetta al nostro Regolamento.
Declinazione di responsabilità
Le informazioni e le pubblicazioni non sono intese come, e non costituiscono, consulenza o raccomandazioni finanziarie, di investimento, di trading o di altro tipo fornite o approvate da TradingView. Per ulteriori informazioni, consultare i Termini di utilizzo.