OPEN-SOURCE SCRIPT
Aggiornato Correlation Coefficient Colored Candles
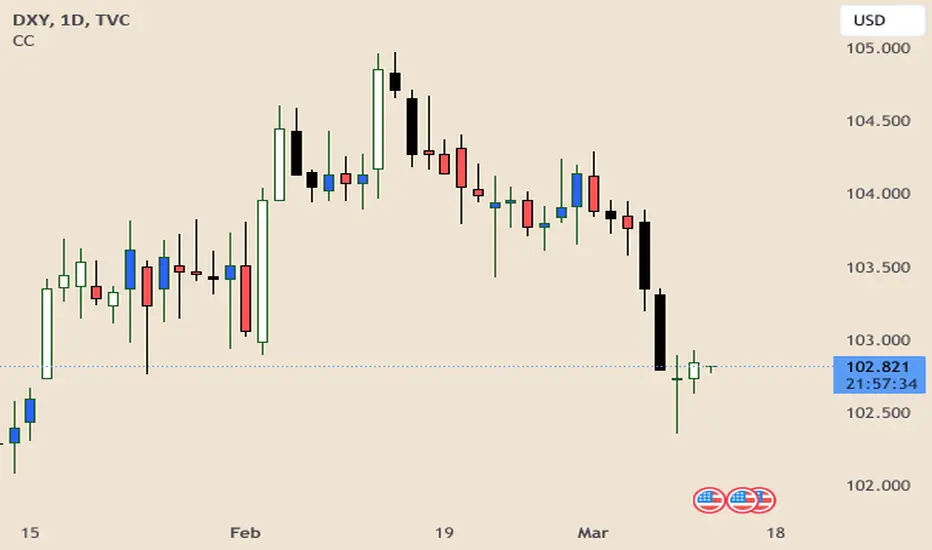
This script utilizes Tradingview's built in Correlation Coefficient indicator to calculate the correlation coefficient between two assets and changes candle colors based on the related data.
Info From Correlation Coefficient Indicator:
Correlation Coefficient (CC) is used in statistics to measure the correlation between two sets of data. In the trading world, the data sets would be stocks, etf's or any other financial instrument. The correlation between two financial instruments, simply put, is the degree in which they are related. Correlation is based on a scale of 1 to -1. The closer the Correlation Coefficient is to 1, the higher their positive correlation. The instruments will move up and down together. The higher the Correlation efficient is to -1, the more they move in opposite directions. A value at 0 indicates that there is no correlation.
This indicator allows for choosing the correlated asset, between direct and inverse correlation, the length of the series, and the correlation factor that will trigger the candles to change colors.
Example 1: You choose Direct correlation with a factor of 0.75, the candles that fall below that correlation factor will paint in your desired colors based on their closing price (up or down).
Example 2: You choose Inverse correlation with a factor of -0.75, the candles that rise above that correlation factor will paint in your desired colors based on their closing price (up or down).
Chart Shows Direct correlation of DXY and US10Y with length 3 and correlation factor of 0.75
Note di rilascio
Updated to set min and max values for correlation factor, and added a step value.*** Example 3: NQ and DXY, Inverse Correlation, Factor 0.5. Candles will color when NQ price movement is correlated with DXY; instead of being inverse.
Length
The time period to be used in calculating the correlation.
Script open-source
Nello spirito di TradingView, l'autore di questo script lo ha reso open source, in modo che i trader possano esaminarne e verificarne la funzionalità. Complimenti all'autore! Sebbene sia possibile utilizzarlo gratuitamente, ricordiamo che la ripubblicazione del codice è soggetta al nostro Regolamento.
Declinazione di responsabilità
Le informazioni e le pubblicazioni non sono intese come, e non costituiscono, consulenza o raccomandazioni finanziarie, di investimento, di trading o di altro tipo fornite o approvate da TradingView. Per ulteriori informazioni, consultare i Termini di utilizzo.