OPEN-SOURCE SCRIPT
[jT] Real Candles
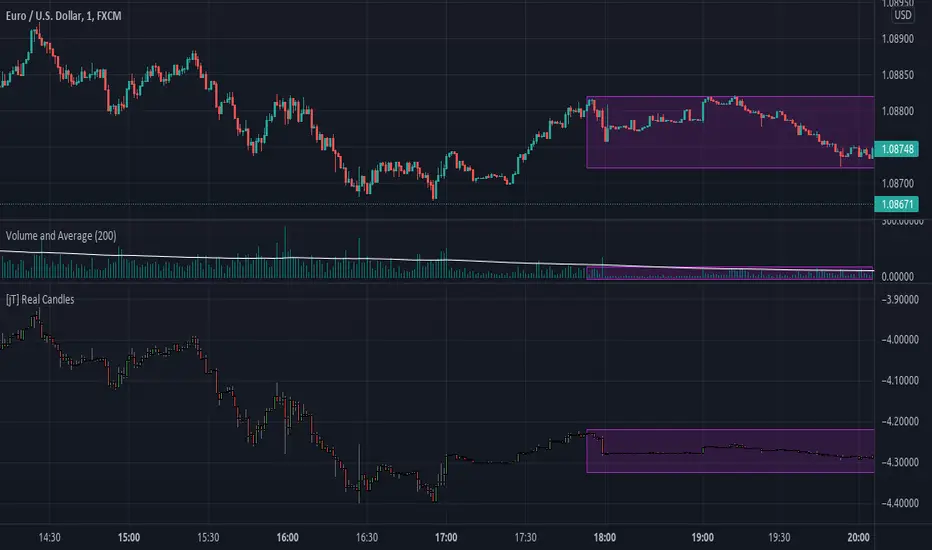
This is an "indicator" that takes the candle's size and multiply it by the current volume, so now the candle size is affected by how much volume is being traded.
Here we assume that the volume traded is essential, and now it kinda have a weight on how the price acts. So "dead-volume" areas will be almost inexpressive in the chart, while the areas with huge volume are where the volatility really happens.
Note: the purple rectangles aren't part of the script, they are just to show how a area with no volume behaves.
Script open-source
Nello spirito di TradingView, l'autore di questo script lo ha reso open source, in modo che i trader possano esaminarne e verificarne la funzionalità. Complimenti all'autore! Sebbene sia possibile utilizzarlo gratuitamente, ricordiamo che la ripubblicazione del codice è soggetta al nostro Regolamento.
Declinazione di responsabilità
Le informazioni e le pubblicazioni non sono intese come, e non costituiscono, consulenza o raccomandazioni finanziarie, di investimento, di trading o di altro tipo fornite o approvate da TradingView. Per ulteriori informazioni, consultare i Termini di utilizzo.