PROTECTED SOURCE SCRIPT
52SIGNAL RECIPE RSI Linreg Bands
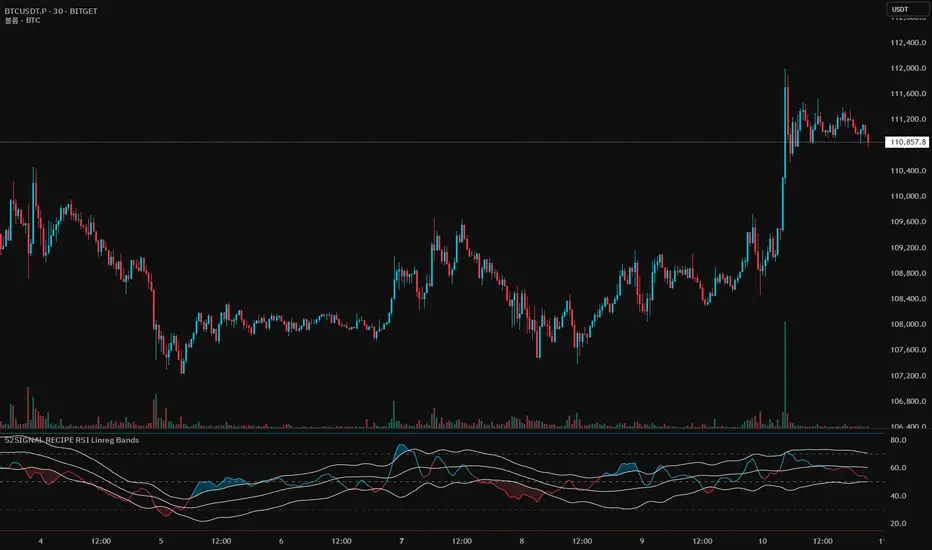
═══ 52SIGNAL RECIPE RSI Linreg Bands ═══
◆ Overview
52SIGNAL RECIPE RSI Linreg Bands is an advanced technical indicator that combines the RSI (Relative Strength Index) with Linear Regression Bands. This indicator visualizes the volatility of the RSI using linear regression bands, helping to clearly identify overbought/oversold areas and more accurately capture potential trend reversal points.
─────────────────────────────────────
◆ Key Features
• RSI-Based Overbought/Oversold Analysis: Uses the traditional RSI indicator to identify overbought/oversold conditions in the market
• Integrated Linear Regression Bands: Applies linear regression analysis to the RSI to visually represent the direction and strength of trends
• Dual Overbought/Oversold Levels: Sets overbought/oversold levels for both RSI and Linear Regression Bands to increase the accuracy of signals
• Advanced Visualization: Intuitive chart analysis is possible with color changes according to trend direction and clear band display
• Multiple Alert Settings: Alert functions for various conditions ensure you don't miss important trading moments
─────────────────────────────────────
◆ Technical Foundation
■ RSI (Relative Strength Index)
• Basic Settings: 14-period RSI with 5-period Weighted Moving Average (WMA) applied
• Calculation Method: Measures the relative strength of gains and losses, expressed as a value between 0-100
• Overbought/Oversold Levels: Default values set to 70 (overbought) and 30 (oversold)
■ Linear Regression Bands
• Period: Default value of 100 days
• Deviation: Default value of 2.5 standard deviations
• Center Line: The center line of the linear regression analysis for the RSI values
• Band Width: Displays the range of volatility around the center line based on the calculated standard deviation
• Overbought/Oversold Levels: Default values set to 85 (overbought) and 15 (oversold)
─────────────────────────────────────
◆ Practical Applications
■ Identifying Trading Signals
• Buy Signal:
▶ When the RSI falls below the oversold level (30)
▶ When the lower band of the Linear Regression Bands falls below the oversold level (15)
▶ When both conditions are met simultaneously (extreme oversold state) - a strong buy signal
• Sell Signal:
▶ When the RSI rises above the overbought level (70)
▶ When the upper band of the Linear Regression Bands rises above the overbought level (85)
▶ When both conditions are met simultaneously (extreme overbought state) - a strong sell signal
■ Trend Analysis
• Uptrend: When the linear regression center line is rising and the RSI is moving above the midline (50)
• Downtrend: When the linear regression center line is falling and the RSI is moving below the midline (50)
• Trend Strength: The wider the gap between the bands, the greater the volatility; the narrower, the more stable the trend
■ Divergence Confirmation
• Bearish Divergence: Price forms a new high, but the RSI is lower than the previous high (potential bearish signal)
• Bullish Divergence: Price forms a new low, but the RSI is higher than the previous low (potential bullish signal)
─────────────────────────────────────
◆ Advanced Setting Options
■ RSI Setting Adjustments
• RSI Source: Selectable options include Close (default), Open, High, Low, HL2, HLC3, OHLC4, etc.
• RSI Length: Adjust to lower values for short-term volatility, higher values for long-term trends
■ Linear Regression Setting Adjustments
• Period: Use lower values (20-50) for short-term analysis, higher values (100-200) for long-term analysis
• Deviation: Higher values create wider bands (more signals), lower values create narrower bands (more accurate signals)
■ Overbought/Oversold Level Adjustments
• RSI Levels: Adjust to more extreme values (80/20) in highly volatile markets
• Linear Regression Band Levels: Adjustable to 90/10 or 80/20 depending on market conditions
─────────────────────────────────────
◆ Synergy with Other Indicators
• Bollinger Bands: Use alongside Bollinger Bands on the price chart to compare price volatility with RSI volatility
• MACD: Use with MACD for momentum and trend confirmation
• Fibonacci Retracement: Check RSI Linreg Bands signals with key support/resistance levels
• Moving Averages: Combine moving average crossovers with RSI Linreg Bands signals to improve reliability
─────────────────────────────────────
◆ Conclusion
52SIGNAL RECIPE RSI Linreg Bands provides a powerful and accurate technical analysis tool by combining traditional RSI with linear regression analysis. The dual overbought/oversold system increases the accuracy of trading signals and clearly visualizes trend direction and strength to help traders make decisions. You can achieve optimal results by adjusting various settings to match your trading style and market conditions.
─────────────────────────────────────
※ Disclaimer: Past performance does not guarantee future results. Always use appropriate risk management strategies.
═══ 52SIGNAL RECIPE RSI 선형회귀 밴드 ═══
◆ 개요
52SIGNAL RECIPE RSI 선형회귀 밴드는 RSI(상대강도지수)와 선형회귀 밴드를 결합한 고급 기술적 지표입니다. 이 지표는 선형회귀 밴드를 사용하여 RSI의 변동성을 시각화하여 과매수/과매도 영역을 명확하게 식별하고 잠재적인 추세 반전 지점을 더 정확하게 포착하는 데 도움을 줍니다.
─────────────────────────────────────
◆ 주요 특징
• RSI 기반 과매수/과매도 분석: 전통적인 RSI 지표를 사용하여 시장의 과매수/과매도 상태를 식별
• 통합된 선형회귀 밴드: RSI에 선형회귀 분석을 적용하여 추세의 방향과 강도를 시각적으로 표현
• 이중 과매수/과매도 레벨: RSI와 선형회귀 밴드 모두에 과매수/과매도 레벨을 설정하여 신호의 정확도 향상
• 고급 시각화: 추세 방향에 따른 색상 변화와 명확한 밴드 표시로 직관적인 차트 분석 가능
• 다중 알림 설정: 다양한 조건에 대한 알림 기능으로 중요한 트레이딩 시점을 놓치지 않도록 보장
─────────────────────────────────────
◆ 기술적 기반
■ RSI (상대강도지수)
• 기본 설정: 14기간 RSI에 5기간 가중이동평균(WMA) 적용
• 계산 방법: 상승과 하락의 상대적 강도를 측정하여 0-100 사이의 값으로 표현
• 과매수/과매도 레벨: 기본값으로 70(과매수)과 30(과매도) 설정
■ 선형회귀 밴드
• 기간: 기본값 100일
• 편차: 기본값 2.5 표준편차
• 중심선: RSI 값에 대한 선형회귀 분석의 중심선
• 밴드 폭: 계산된 표준편차에 기반하여 중심선 주변의 변동성 범위 표시
• 과매수/과매도 레벨: 기본값으로 85(과매수)와 15(과매도) 설정
─────────────────────────────────────
◆ 실용적 응용
■ 트레이딩 신호 식별
• 매수 신호:
▶ RSI가 과매도 레벨(30) 아래로 떨어질 때
▶ 선형회귀 밴드의 하단이 과매도 레벨(15) 아래로 떨어질 때
▶ 두 조건이 동시에 충족될 때(극단적 과매도 상태) - 강한 매수 신호
• 매도 신호:
▶ RSI가 과매수 레벨(70) 위로 상승할 때
▶ 선형회귀 밴드의 상단이 과매수 레벨(85) 위로 상승할 때
▶ 두 조건이 동시에 충족될 때(극단적 과매수 상태) - 강한 매도 신호
■ 추세 분석
• 상승 추세: 선형회귀 중심선이 상승하고 RSI가 중간선(50) 위로 움직일 때
• 하락 추세: 선형회귀 중심선이 하락하고 RSI가 중간선(50) 아래로 움직일 때
• 추세 강도: 밴드 사이의 간격이 넓을수록 변동성이 크고, 좁을수록 추세가 안정적
■ 다이버전스 확인
• 약세 다이버전스: 가격이 신고점을 형성하지만 RSI가 이전 고점보다 낮을 때(잠재적 약세 신호)
• 강세 다이버전스: 가격이 신저점을 형성하지만 RSI가 이전 저점보다 높을 때(잠재적 강세 신호)
─────────────────────────────────────
◆ 고급 설정 옵션
■ RSI 설정 조정
• RSI 소스: 선택 가능한 옵션에는 종가(기본값), 시가, 고가, 저가, HL2, HLC3, OHLC4 등이 포함
• RSI 길이: 단기 변동성을 위해 낮은 값으로, 장기 추세를 위해 높은 값으로 조정
■ 선형회귀 설정 조정
• 기간: 단기 분석을 위해 낮은 값(20-50), 장기 분석을 위해 높은 값(100-200) 사용
• 편차: 높은 값은 더 넓은 밴드(더 많은 신호), 낮은 값은 더 좁은 밴드(더 정확한 신호) 생성
■ 과매수/과매도 레벨 조정
• RSI 레벨: 변동성이 큰 시장에서는 더 극단적인 값(80/20)으로 조정
• 선형회귀 밴드 레벨: 시장 상황에 따라 90/10 또는 80/20으로 조정 가능
─────────────────────────────────────
◆ 다른 지표와의 시너지
• 볼린저 밴드: 가격 차트의 볼린저 밴드와 함께 사용하여 가격 변동성과 RSI 변동성 비교
• MACD: 모멘텀과 추세 확인을 위해 MACD와 함께 사용
• 피보나치 되돌림: RSI 선형회귀 밴드 신호를 주요 지지/저항 레벨과 함께 확인
• 이동평균선: 이동평균 교차와 RSI 선형회귀 밴드 신호를 결합하여 신뢰성 향상
─────────────────────────────────────
◆ 결론
52SIGNAL RECIPE RSI 선형회귀 밴드는 전통적인 RSI와 선형회귀 분석을 결합하여 강력하고 정확한 기술적 분석 도구를 제공합니다. 이중 과매수/과매도 시스템은 트레이딩 신호의 정확도를 높이고 추세 방향과 강도를 명확하게 시각화하여 트레이더의 의사 결정을 돕습니다. 다양한 설정을 트레이딩 스타일과 시장 상황에 맞게 조정하여 최적의 결과를 얻을 수 있습니다.
─────────────────────────────────────
※ 면책 조항: 과거 성과가 미래 결과를 보장하지 않습니다. 항상 적절한 리스크 관리 전략을 사용하세요.
Script protetto
Questo script è pubblicato come codice protetto. Tuttavia, è possibile utilizzarle liberamente e senza alcuna limitazione – ulteriori informazioni qui.
Recipe your trading with 52SIGNAL.
No more repainting tricks, fake backtesting data, or unrealistic returns.
No more repainting tricks, fake backtesting data, or unrealistic returns.
Declinazione di responsabilità
Le informazioni e le pubblicazioni non sono intese come, e non costituiscono, consulenza o raccomandazioni finanziarie, di investimento, di trading o di altro tipo fornite o approvate da TradingView. Per ulteriori informazioni, consultare i Termini di utilizzo.