OPEN-SOURCE SCRIPT
Bitcoin Stalemate Indicator
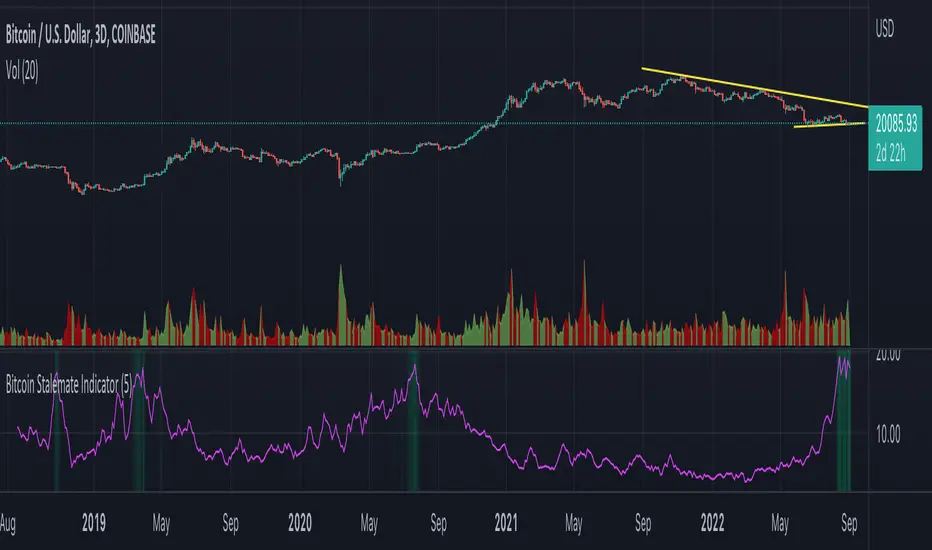
The Bitcoin Stalemate Indicator examines periods in the market defined by a combination of high volume and low price volatility. These periods are a bit like a tug-of-war with both sides applying a lot of force but the rope moving very little. Periods of high volume and low volatility suggest both sides of the trade are stuck in a stalemate. This indicator may be useful in identifying psychologically important price levels.
The mechanics of the indicator are fairly simple: the indicator takes the volume and divides it by the candle’s size over it’s close for that same period.
volume / ((high - low) / close)
Candles that move very little but with high volume will produce higher reads and vice versa. Finally a smoothing average is applied to clean up the noise.
Volume profiles from the top 6 exchanges are averaged in order to avoid a single exchange’s popularity acting as an overriding factor. Single exchanges can be isolated but are of lesser use. Heat map functionality is only active when all exchanges are selected.
Script open-source
Nello spirito di TradingView, l'autore di questo script lo ha reso open source, in modo che i trader possano esaminarne e verificarne la funzionalità. Complimenti all'autore! Sebbene sia possibile utilizzarlo gratuitamente, ricordiamo che la ripubblicazione del codice è soggetta al nostro Regolamento.
Declinazione di responsabilità
Le informazioni e le pubblicazioni non sono intese come, e non costituiscono, consulenza o raccomandazioni finanziarie, di investimento, di trading o di altro tipo fornite o approvate da TradingView. Per ulteriori informazioni, consultare i Termini di utilizzo.