OPEN-SOURCE SCRIPT
Aggiornato + Bollinger Bands Width
Here is my rendition of Bollinger Bands Width. If you are unfamiliar, Bollinger Bands Width is a measure of the distance between the top and bottom bands of Bollinger Bands. Bollinger Bands themselves being a measure of market volatility, BB Width is a simpler, cleaner way of determining the amount of volatility in the market. Myself, I found the original, basic version of BB Width a bit too basic, and I thought that by adding to it it might make for an improvement for traders over the original.
Simple things that I've done are adding a signal line; adding a 'baseline' using Donchian Channels (such as that which is in my Average Candle Bodies Range indicator); adding bar and background coloring; and adding alerts for increasing volatility, and baseline and signal line crosses. It really ends up making for a much improved version of the basic indicator.
A note on how I created the baseline:
First, what do I mean by 'baseline?' I think of it as an area of the indicator where if the BB Width is below you will not want to enter into any trades, and if the BB Width is above then you are free to enter trades based on your system. It's basically a volatility measure of the volatility indicator. Waddah Attar Explosion is a popular indicator that implements something similar. The baseline is calculated thus: make a Donchian Channel of the BB Width, and then use the basis as the baseline while not plotting the actual highs and lows of the Donchian Channel. Now, the basis of a Donchian Channel is the average of the highs and the lows. If we did that here we would have a baseline much too high, however, by making the basis adjustable with a divisor input it no longer must be plotted in the center of the channel, but may be moved much lower (unless you set the divisor to 2, but you wouldn't do that). This divisor is essentially a sensitivity adjustment for the indicator. Of course you don't have to use the baseline. You could ignore it and only use the signal line, or just use the rising and falling of the BB Width by itself as your volatility measure.
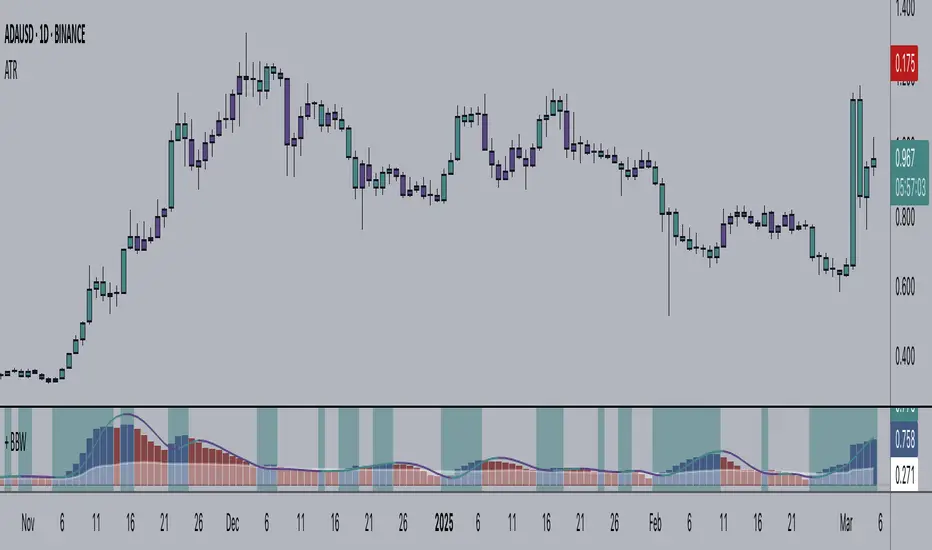
I should make note: the main image above at default settings is an 8 period lookback (so, yes, that is quite fast), and the signal line is a Hull MA set to 13. The background and bar coloring are simply set to the rising and falling of the BB Width. Images below will show some different settings, but definitely play with it yourself to determine if it might be a good fit for your system.

Above, settings are background and bar coloring tuned to BB Width being above the baseline, and also requiring that the BB Width be rising. Background coloring only highlights increasing volatility or volatility above a certain threshold. Grey candles are because the BB Width is above the baseline but falling. We'll see an example without the requirement of BB Width rising, below.

Here, we see that background highlights and aqua candles are more prevalent because I've checked off the requirement that BB Width be rising. The idea is that BB Width is above the baseline therefor there is sufficient volatility to enter trades if our indicators give us the go-ahead.

This here is set to BB Width being above the signal line and also requiring a rising BB Width. Keep in mind the signal line is a Hull MA.

And this fourth and final image uses a volume-weighted MA as the signal line. Bar coloring is turned off, and instead the checkboxes for volatility advancing and declining are turned on under the signal line options. BB Width crosses up the signal line is advancing volatility, while falling below it is declining volatility. Background highlights are set to baseline and not requiring a rising BB Width. This way, with a quick glance you can see if the rising volatility is legitimate, i.e., is the cross up of the signal line coupled with it being above the baseline.
Please enjoy.
Simple things that I've done are adding a signal line; adding a 'baseline' using Donchian Channels (such as that which is in my Average Candle Bodies Range indicator); adding bar and background coloring; and adding alerts for increasing volatility, and baseline and signal line crosses. It really ends up making for a much improved version of the basic indicator.
A note on how I created the baseline:
First, what do I mean by 'baseline?' I think of it as an area of the indicator where if the BB Width is below you will not want to enter into any trades, and if the BB Width is above then you are free to enter trades based on your system. It's basically a volatility measure of the volatility indicator. Waddah Attar Explosion is a popular indicator that implements something similar. The baseline is calculated thus: make a Donchian Channel of the BB Width, and then use the basis as the baseline while not plotting the actual highs and lows of the Donchian Channel. Now, the basis of a Donchian Channel is the average of the highs and the lows. If we did that here we would have a baseline much too high, however, by making the basis adjustable with a divisor input it no longer must be plotted in the center of the channel, but may be moved much lower (unless you set the divisor to 2, but you wouldn't do that). This divisor is essentially a sensitivity adjustment for the indicator. Of course you don't have to use the baseline. You could ignore it and only use the signal line, or just use the rising and falling of the BB Width by itself as your volatility measure.
I should make note: the main image above at default settings is an 8 period lookback (so, yes, that is quite fast), and the signal line is a Hull MA set to 13. The background and bar coloring are simply set to the rising and falling of the BB Width. Images below will show some different settings, but definitely play with it yourself to determine if it might be a good fit for your system.
Above, settings are background and bar coloring tuned to BB Width being above the baseline, and also requiring that the BB Width be rising. Background coloring only highlights increasing volatility or volatility above a certain threshold. Grey candles are because the BB Width is above the baseline but falling. We'll see an example without the requirement of BB Width rising, below.
Here, we see that background highlights and aqua candles are more prevalent because I've checked off the requirement that BB Width be rising. The idea is that BB Width is above the baseline therefor there is sufficient volatility to enter trades if our indicators give us the go-ahead.
This here is set to BB Width being above the signal line and also requiring a rising BB Width. Keep in mind the signal line is a Hull MA.
And this fourth and final image uses a volume-weighted MA as the signal line. Bar coloring is turned off, and instead the checkboxes for volatility advancing and declining are turned on under the signal line options. BB Width crosses up the signal line is advancing volatility, while falling below it is declining volatility. Background highlights are set to baseline and not requiring a rising BB Width. This way, with a quick glance you can see if the rising volatility is legitimate, i.e., is the cross up of the signal line coupled with it being above the baseline.
Please enjoy.
Note di rilascio
- update to pine v6- added timeframe selection
- cleaned up and organized the script and code a lot
- created a bank of color inputs, so now it's intuitive to change colors of various pieces of the indicator instead of the mess that was earlier
- changed the default color pallet to something more muted
Enjoy :)
Note di rilascio
- don't mind me... just fixing a few mistakes from the most recent update, notably applying a color swatch to the signal line that I should not have, and fixing some misspellingsScript open-source
Nello spirito di TradingView, l'autore di questo script lo ha reso open source, in modo che i trader possano esaminarne e verificarne la funzionalità. Complimenti all'autore! Sebbene sia possibile utilizzarlo gratuitamente, ricordiamo che la ripubblicazione del codice è soggetta al nostro Regolamento.
Declinazione di responsabilità
Le informazioni e le pubblicazioni non sono intese come, e non costituiscono, consulenza o raccomandazioni finanziarie, di investimento, di trading o di altro tipo fornite o approvate da TradingView. Per ulteriori informazioni, consultare i Termini di utilizzo.
Script open-source
Nello spirito di TradingView, l'autore di questo script lo ha reso open source, in modo che i trader possano esaminarne e verificarne la funzionalità. Complimenti all'autore! Sebbene sia possibile utilizzarlo gratuitamente, ricordiamo che la ripubblicazione del codice è soggetta al nostro Regolamento.
Declinazione di responsabilità
Le informazioni e le pubblicazioni non sono intese come, e non costituiscono, consulenza o raccomandazioni finanziarie, di investimento, di trading o di altro tipo fornite o approvate da TradingView. Per ulteriori informazioni, consultare i Termini di utilizzo.