PROTECTED SOURCE SCRIPT
Buy/Sell Pressure

!!!!! DISCLAIMER !!!!!
- No indicator can tell the future.
- This indicator doesn't tell you when to buy or sell.
- Don't use this indicator alone without any other indicator.
- It doesn't tell short or long squeeze.
- It's just an extra tool can be added to your existing strategy.
- If the source/data vendor doesn't provide volume, it will compile a runtime error: "No volume is provided by the data vendor.".
//Indicator Basis
This indicator is based on Average Directional Index (ADX) and transaction quantity (Volume).
From ADX, it's using a modified Directional Index Plus and Directional Index Minus.
From Volume, it's assume based on candle how many buyers or sellers in that volume.
---------------------------------------------------------------------------------------------------------------------------------
I'm not planning to publish the source-code but wanted to gave a basis on which existing indicators I used.
---------------------------------------------------------------------------------------------------------------------------------
//Indicator Description
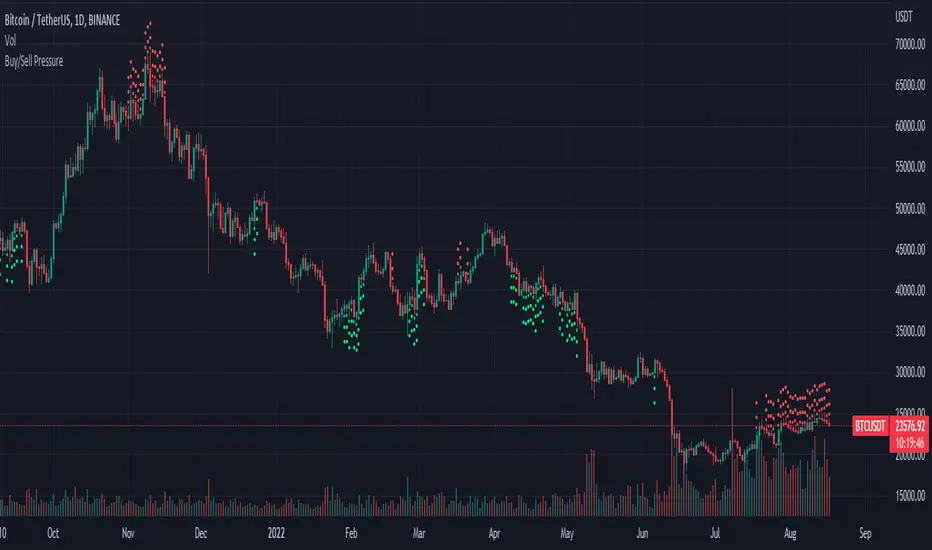
The indicator show the conditions when the price change is not align with the volume. The buyers want the price go up and the sellers want the price go down.
When the price change is moved to the upside but in the volume show there are more sellers than buyers.
When the price change is moved to the downside but in the volume show there are more buyers than sellers.
It doesn't tells you when we are in short or long squeeze conditions!
It only tell you there are more buyers/sellers dispite the price change to the upside/downside.
When we are either condition, the price can go up or down. It's just helps to find who want take control, the bears (sellers) or bulls (buyers).
As long as the source/data vendor provides volume, it's usable in every time frame.
//Settings
Defualt settings:- Opted in - Red circles above the bar - more sellers dispite the price changed to the upside
- Opted in - Green circles below the bar - more buyers dispite the price changed to the downside
- Opted out - Orange background in the chart with 50% transparency - more sellers dispite the price changed to the upside
- Opted out - Olivie background in the chart with 50% transparency - more buyers dispite the price changed to the downside
Colors, shapes can be customized as you like it.
- Opted in - Red circles above the bar - more sellers dispite the price changed to the upside
Script protetto
Questo script è pubblicato come codice protetto. Tuttavia, è possibile utilizzarle liberamente e senza alcuna limitazione – ulteriori informazioni qui.
Declinazione di responsabilità
Le informazioni e le pubblicazioni non sono intese come, e non costituiscono, consulenza o raccomandazioni finanziarie, di investimento, di trading o di altro tipo fornite o approvate da TradingView. Per ulteriori informazioni, consultare i Termini di utilizzo.