PROTECTED SOURCE SCRIPT
YBL – Tick CVD PRO (CVD + Precio Normalizado + Divergencias)
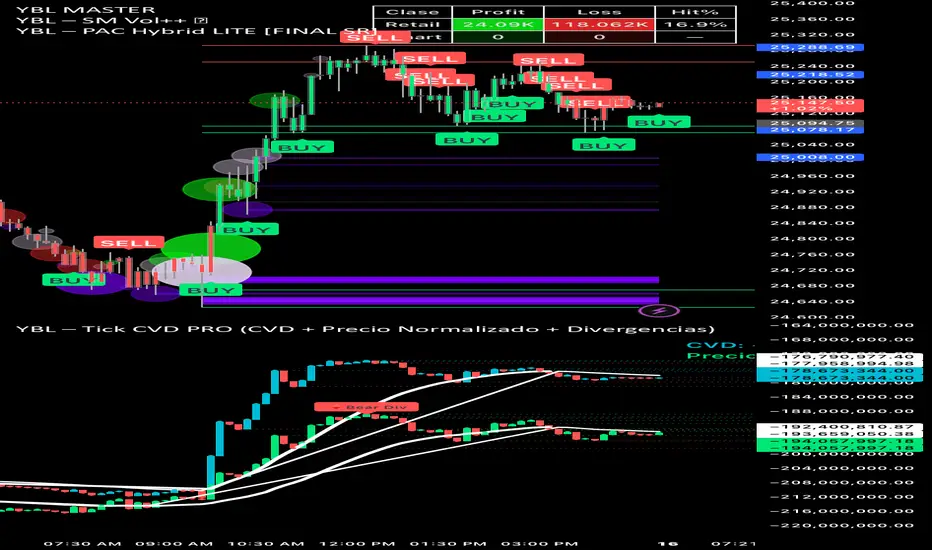
YBL – Tick CVD PRO (CVD + Normalized Price + Divergences)
YBL – Tick CVD PRO is a tick-based Cumulative Volume Delta engine that plots CVD and a normalized price curve in the same panel, making it easy to see when price and aggression are aligned or diverging.
The script focuses on intraday order-flow context, showing where real buying/selling pressure is coming in, where it is fading, and where price is moving without confirmation from CVD.
⸻
Main features
• Tick CVD engine
• Cumulative Volume Delta calculated either as:
• volume × price change (more sensitive), or
• absolute volume by candle color (classic +/– volume).
• Option to accumulate only during a chosen session window (e.g. 09:30–16:00).
• Normalized Price Overlay
• Price is normalized into the same range as CVD over a lookback window, so you can visually compare:
• when price makes new highs/lows with CVD confirmation, and
• when price prints extremes without CVD support (potential traps).
• Two visual modes
• Line mode or candle mode for both CVD and normalized price.
• Aesthetic / Efficient visual presets (different fill transparencies for clearer reading depending on style and performance).
• Adaptive Moving Averages
• Independent MAs for CVD and normalized price:
• WMA, HMA, SMA, EMA, or None.
• Optional:
• Color by MA type.
• Thicker line when the slope is positive, making trend shifts easier to spot at a glance.
• Key levels & dots
• Automatic key levels (pivot highs/lows) for CVD and normalized price, extended to the right.
• Optional dots on CVD and price curves, with the possibility to show numeric values as labels.
• Divergences (HH/LL)
• Automatic bearish divergence:
• Price makes a higher high, but CVD fails to confirm → “🔻Bear Div”.
• Automatic bullish divergence:
• Price makes a lower low, but CVD fails to confirm → “🔺Bull Div”.
• Pivot lengths are fully configurable.
• Session-aware CVD
• Choose an exchange session (e.g. 09:30–16:00) and optionally accumulate CVD only inside that range, resetting behavior for better intraday reading.
• Alerts
• CVD crossing above/below its MA (momentum shift).
• Bullish & bearish divergence signals.
These alerts can be used to build automated conditions in your strategy or to receive notifications.
• Quick header display
• On the last bar, a compact header shows:
• Current CVD value + direction arrow.
• Current normalized price / last close + direction arrow.
⸻
How I personally use it
• Confirm breakouts and trend legs:
• I want price and CVD moving together, with CVD making new extremes in the direction of the move.
• Spot traps and absorption:
• When price makes a new high/low but CVD diverges, I pay attention to potential reversals or exhaustion.
• Filter entries from my main YBL tools:
• I prefer to trade with CVD slope and MA direction, and I am cautious when entries appear against clear CVD pressure.
⸻
⚠️ Disclaimer:
This script is for educational and analytical purposes only and is not financial advice. Always do your own research and manage your risk.
Script protetto
Questo script è pubblicato come codice protetto. Tuttavia, è possibile utilizzarle liberamente e senza alcuna limitazione – ulteriori informazioni qui.
Declinazione di responsabilità
Le informazioni e le pubblicazioni non sono intese come, e non costituiscono, consulenza o raccomandazioni finanziarie, di investimento, di trading o di altro tipo fornite o approvate da TradingView. Per ulteriori informazioni, consultare i Termini di utilizzo.