OPEN-SOURCE SCRIPT
Aggiornato 3cf
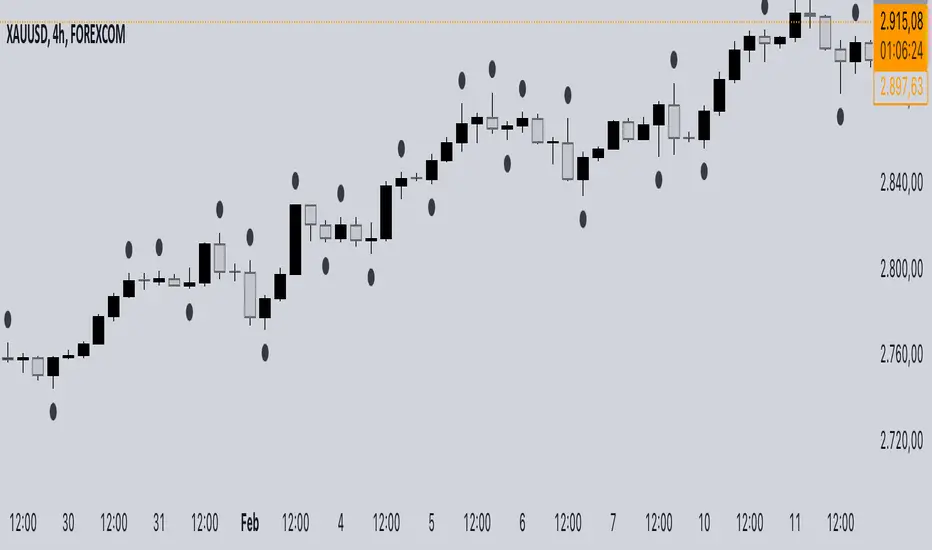
This indicator identifies and signals the points of swing highs and swing lows on the price chart using an algorithm based on market structure. Local highs and lows are highlighted with a colored dot, making it easier to perform technical analysis and recognize trend reversals.
The indicator analyzes a predefined number of bars (e.g., 5 candles) to determine relative highs and lows:
Swing High (Local High) → The current candle has a higher high compared to the previous and subsequent candle.
Swing Low (Local Low) → The current candle has a lower low compared to the previous and subsequent candle.
When a candle meets one of these conditions, a visual dot is placed to indicate the potential reversal point.
Note di rilascio
Added a toggle option to enable or disable the display of local highs and lows in the script. This is done using an input(true, title="Show max/min") checkbox, which allows users to control whether the plotted markers for highs and lows are shown. The plotshape functions are modified to check the enableDisplay variable, ensuring that the circles are only drawn when the option is enabled.Script open-source
Nello spirito di TradingView, l'autore di questo script lo ha reso open source, in modo che i trader possano esaminarne e verificarne la funzionalità. Complimenti all'autore! Sebbene sia possibile utilizzarlo gratuitamente, ricordiamo che la ripubblicazione del codice è soggetta al nostro Regolamento.
Declinazione di responsabilità
Le informazioni e le pubblicazioni non sono intese come, e non costituiscono, consulenza o raccomandazioni finanziarie, di investimento, di trading o di altro tipo fornite o approvate da TradingView. Per ulteriori informazioni, consultare i Termini di utilizzo.
Script open-source
Nello spirito di TradingView, l'autore di questo script lo ha reso open source, in modo che i trader possano esaminarne e verificarne la funzionalità. Complimenti all'autore! Sebbene sia possibile utilizzarlo gratuitamente, ricordiamo che la ripubblicazione del codice è soggetta al nostro Regolamento.
Declinazione di responsabilità
Le informazioni e le pubblicazioni non sono intese come, e non costituiscono, consulenza o raccomandazioni finanziarie, di investimento, di trading o di altro tipo fornite o approvate da TradingView. Per ulteriori informazioni, consultare i Termini di utilizzo.