OPEN-SOURCE SCRIPT
Aggiornato Support and Resistance all in one
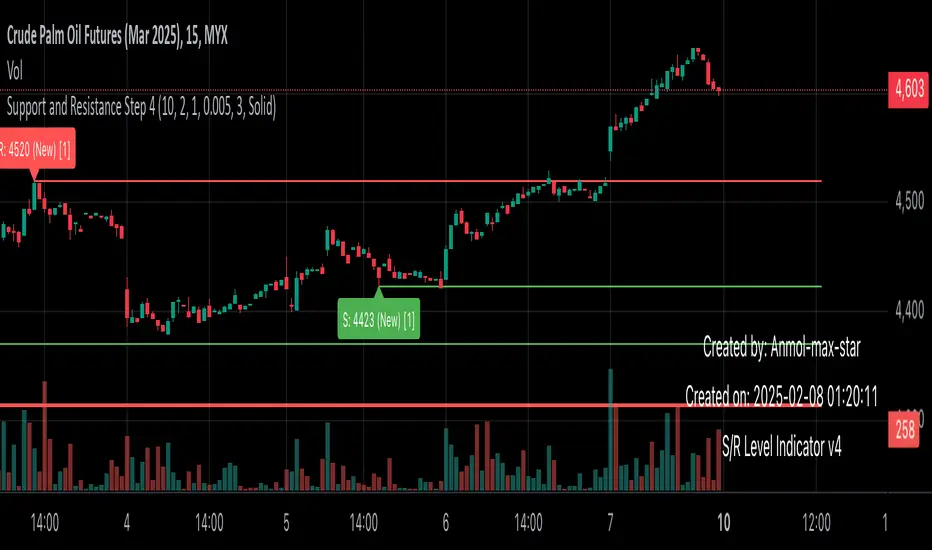
The Support and Resistance Indicator (v4) is designed to identify and track key price levels in financial markets. Here's how it works:
Core Functionality
Level Detection
Uses pivot points to identify significant price levels
Looks for swing highs (resistance) and swing lows (support)
Requires price action to pivot over a specified period (default 10 bars)
Dynamic Level Management
Maintains separate arrays for support and resistance levels
Limits maximum displayed levels (default 10) to prevent chart clutter
Removes oldest levels when maximum is reached
Ensures new levels are sufficiently distant from existing ones (minimum 1% separation)
Touch Detection System
Monitors price interaction with established levels
Counts when price comes within 0.1% of any level
Updates touch count and strength classification
Categories: "New" (1 touch), "Moderate" (2 touches), "Strong" (3+ touches)
Visual Representation
Draws horizontal lines at each level
Updates line width based on strength (thicker for stronger levels)
Shows labels with price and strength information
Color coding: Red (new/moderate levels), Green (strong levels)
Displays triangles (▼▲) at pivot points
Trading Applications
Support/Resistance Trading
Strong levels (3+ touches) suggest reliable trading zones
More touches indicate higher probability reversal points
Use for stop loss and target placement
Breakout Trading
Monitor breaks of strong levels
Higher touch count suggests more significant breakouts
Watch for false breakouts at weaker levels
Risk Management
Place stops beyond strong levels
Use level strength to adjust position size
Consider multiple timeframe analysis
Best Practices
Use with other indicators for confirmation
Consider market context and trend
Monitor level strength development
Don't rely solely on touch count
Watch for price reaction at levels
Customization Options
Adjust pivot length for different timeframes
Modify minimum distance between levels
Change required touches for "Strong" classification
Toggle strength labels display
Choose line style (Solid/Dashed/Dotted)
This indicator helps identify key price levels where market participants have shown interest, making it valuable for trade planning and risk management
Note di rilascio
Here's a comprehensive explanation of your Support and Resistance indicator:Overall Concept: This is an advanced Support and Resistance indicator that automatically identifies key price levels where the market tends to reverse or pause. It works by detecting pivot highs (resistance) and pivot lows (support), tracking how many times price touches these levels, and dynamically updating their strength. The indicator maintains a maximum number of levels (default 2) and automatically removes older levels when new ones are formed. Each level is visually represented with lines and labels, and the indicator shows touch points with arrows (⬆ for support, ⬇ for resistance) to help traders identify significant price interactions.
Key Features and Usage:
Dynamic Level Detection
Uses pivotLength (default 10) to identify significant price swings
Maintains minimum distance (minDistance) between levels to prevent overcrowding
Automatically removes oldest levels when maxLevels is reached
Strength Tracking
Counts touches when price approaches within 0.5% of a level
Labels levels as "New" (1 touch), "Moderate" (2 touches), or "Strong" (3+ touches)
Changes line width and color based on strength (thicker lines for strong levels)
Visual Feedback
Shows price levels with horizontal lines (red for resistance, green for support)
Displays touch points with arrows (⬇ red for resistance, ⬆ green for support)
Updates labels with current strength and touch count
Customization Options
maxLevels: Control how many levels to display (1-20)
minDistance: Set minimum spacing between levels (%)
levelStrength: Define touches needed for "Strong" status
lineStyle: Choose between Solid, Dashed, or Dotted lines
Trading Applications
Use as support/resistance zones for entry/exit points
Stronger levels (more touches) suggest more reliable price reactions
Watch for breakouts when price moves decisively through a level
Consider taking profits near strong opposing levels
Best Practices
Use with other indicators for confirmation
Pay special attention to levels with 3+ touches
Consider higher timeframes for more significant levels
Watch for price reaction at touch points
Enjoy the indicator !
Follow more awesome indicators !
Note di rilascio
The Support and Resistance Indicator (v4) is designed to identify and track key price levels in financial markets. Here's how it works:Core Functionality
Level Detection
Uses pivot points to identify significant price levels
Looks for swing highs (resistance) and swing lows (support)
Requires price action to pivot over a specified period (default 10 bars)
Dynamic Level Management
Maintains separate arrays for support and resistance levels
Limits maximum displayed levels (default 10) to prevent chart clutter
Removes oldest levels when maximum is reached
Ensures new levels are sufficiently distant from existing ones (minimum 1% separation)
Touch Detection System
Monitors price interaction with established levels
Counts when price comes within 0.1% of any level
Updates touch count and strength classification
Categories: "New" (1 touch), "Moderate" (2 touches), "Strong" (3+ touches)
Visual Representation
Draws horizontal lines at each level
Updates line width based on strength (thicker for stronger levels)
Shows labels with price and strength information
Color coding: Red (new/moderate levels), Green (strong levels)
Displays triangles (▼▲) at pivot points
Trading Applications
Support/Resistance Trading
Strong levels (3+ touches) suggest reliable trading zones
More touches indicate higher probability reversal points
Use for stop loss and target placement
Breakout Trading
Monitor breaks of strong levels
Higher touch count suggests more significant breakouts
Watch for false breakouts at weaker levels
Risk Management
Place stops beyond strong levels
Use level strength to adjust position size
Consider multiple timeframe analysis
Best Practices
Use with other indicators for confirmation
Consider market context and trend
Monitor level strength development
Don't rely solely on touch count
Watch for price reaction at levels
Customization Options
Adjust pivot length for different timeframes
Modify minimum distance between levels
Change required touches for "Strong" classification
Toggle strength labels display
Choose line style (Solid/Dashed/Dotted)
This indicator helps identify key price levels where market participants have shown interest, making it valuable for trade planning and risk management
1 minute ago
Release Notes
Here's a comprehensive explanation of your Support and Resistance indicator:
Overall Concept: This is an advanced Support and Resistance indicator that automatically identifies key price levels where the market tends to reverse or pause. It works by detecting pivot highs (resistance) and pivot lows (support), tracking how many times price touches these levels, and dynamically updating their strength. The indicator maintains a maximum number of levels (default 2) and automatically removes older levels when new ones are formed. Each level is visually represented with lines and labels, and the indicator shows touch points with arrows (⬆ for support, ⬇ for resistance) to help traders identify significant price interactions.
Key Features and Usage:
Dynamic Level Detection
Uses pivotLength (default 10) to identify significant price swings
Maintains minimum distance (minDistance) between levels to prevent overcrowding
Automatically removes oldest levels when maxLevels is reached
Strength Tracking
Counts touches when price approaches within 0.5% of a level
Labels levels as "New" (1 touch), "Moderate" (2 touches), or "Strong" (3+ touches)
Changes line width and color based on strength (thicker lines for strong levels)
Visual Feedback
Shows price levels with horizontal lines (red for resistance, green for support)
Displays touch points with arrows (⬇ red for resistance, ⬆ green for support)
Updates labels with current strength and touch count
Customization Options
maxLevels: Control how many levels to display (1-20)
minDistance: Set minimum spacing between levels (%)
levelStrength: Define touches needed for "Strong" status
lineStyle: Choose between Solid, Dashed, or Dotted lines
Trading Applications
Use as support/resistance zones for entry/exit points
Stronger levels (more touches) suggest more reliable price reactions
Watch for breakouts when price moves decisively through a level
Consider taking profits near strong opposing levels
Best Practices
Use with other indicators for confirmation
Pay special attention to levels with 3+ touches
Consider higher timeframes for more significant levels
Watch for price reaction at touch points
Enjoy the indicator !
Follow more awesome indicators !
Note di rilascio
touchSensitivityAdded a feature of touch sensitivity.
The more you lower its value the less signals you will get for crossover.
In case of resistance : Consider it a distance between high of a bar and resistance
if you lower it you will naturally get less signals.
In case of support : Consider it as a distance between low and support line
if you lower it you will gradually get less labels as crossover for support line.
I'll add more features
Stay Connected !
Script open-source
Nello spirito di TradingView, l'autore di questo script lo ha reso open source, in modo che i trader possano esaminarne e verificarne la funzionalità. Complimenti all'autore! Sebbene sia possibile utilizzarlo gratuitamente, ricordiamo che la ripubblicazione del codice è soggetta al nostro Regolamento.
Declinazione di responsabilità
Le informazioni e le pubblicazioni non sono intese come, e non costituiscono, consulenza o raccomandazioni finanziarie, di investimento, di trading o di altro tipo fornite o approvate da TradingView. Per ulteriori informazioni, consultare i Termini di utilizzo.