This is an attempt to develop alternative visualisation of financial charts. This script also makes use of new pine feature types which represents User Defined Object Types. You can refer to below documentation to understand more about this feature:
🎲 Structure of new chart components
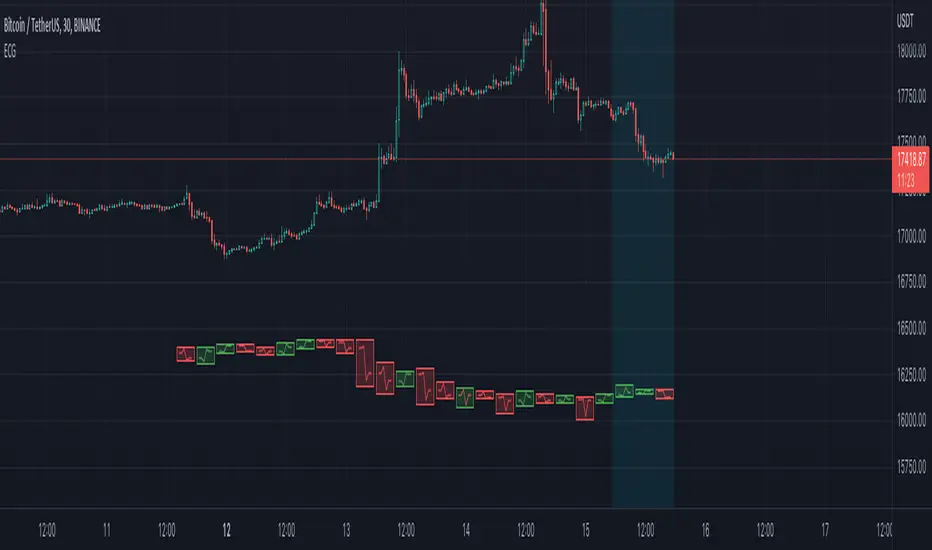
🎯Instead of candles/bars, this type of chart contains Electrocardiogram blocks which resembles the heartbeat signals on electrocardiogram.
🎯Inside each blocks there will be 5 connecting lines called the signal lines.
🎯 Color of the signal lines are determined by which among the high/low of the bar comes last. If highest part of the bar reached after reaching the lowest part of the bar, then signal lines are coloured green signifying bullish sentiment towards the end of bar. If lowest part of the bar reached after reaching the highest part of the bar, then signal lines are coloured red signifying bearish sentiment towards the end of bar.
Pictorial examples here:

🎲 Limitations with pinescript implementation
Thanks to @theheirophant for suggestion of name :)
- tradingview.com/pine-script-docs/en/v5/language/Objects.html
- tradingview.com/pine-script-reference/v5/
🎲 Structure of new chart components
🎯Instead of candles/bars, this type of chart contains Electrocardiogram blocks which resembles the heartbeat signals on electrocardiogram.
- Body color of the block is defined by the open and close prices of the bar. If close is greater than open, body is green. Otherwise, the body is painted red.
- Border color of the block is defined by the close prices of current and previous bar. If the close of current bar is greater than that of last bar, then the border color is green. Otherwise, border color is painted red.
🎯Inside each blocks there will be 5 connecting lines called the signal lines.
- open-open
- open-firstPeak(high or low of the bar whichever comes first)
- firstPeak-secondPeak(high or low of the bar whichever comes last)
- secondPeak-close
- close-close
🎯 Color of the signal lines are determined by which among the high/low of the bar comes last. If highest part of the bar reached after reaching the lowest part of the bar, then signal lines are coloured green signifying bullish sentiment towards the end of bar. If lowest part of the bar reached after reaching the highest part of the bar, then signal lines are coloured red signifying bearish sentiment towards the end of bar.
Pictorial examples here:
🎲 Limitations with pinescript implementation
- Since, pinescript can only use maximum 500 lines and each block will take 1 box and 5 lines, it is not possible to display more than 100 bars.
- Each block of new Electrocardiogram chart will take the space of 7 bars of candlestick chart. Due to this, the alignment of regular OHLC candles is not inline with the new chart type. Background highlighting is done for the part of the OHLC candles where Electrocardiogram blocks are plotted so that it helps users to map the bars manually
Thanks to @theheirophant for suggestion of name :)
Note di rilascio
Update time format logic using str.format_time
Note di rilascio
Replace for loop with for..in loop as the issue with latter is resolved. Also updated logic to calculate offset to avoid candles overlapping with standard candles.Script open-source
Nello spirito di TradingView, l'autore di questo script lo ha reso open source, in modo che i trader possano esaminarne e verificarne la funzionalità. Complimenti all'autore! Sebbene sia possibile utilizzarlo gratuitamente, ricordiamo che la ripubblicazione del codice è soggetta al nostro Regolamento.
Trial - trendoscope.io/trial
Subscribe - trendoscope.io/pricing
Blog - docs.trendoscope.io
Subscribe - trendoscope.io/pricing
Blog - docs.trendoscope.io
Declinazione di responsabilità
Le informazioni e le pubblicazioni non sono intese come, e non costituiscono, consulenza o raccomandazioni finanziarie, di investimento, di trading o di altro tipo fornite o approvate da TradingView. Per ulteriori informazioni, consultare i Termini di utilizzo.
Script open-source
Nello spirito di TradingView, l'autore di questo script lo ha reso open source, in modo che i trader possano esaminarne e verificarne la funzionalità. Complimenti all'autore! Sebbene sia possibile utilizzarlo gratuitamente, ricordiamo che la ripubblicazione del codice è soggetta al nostro Regolamento.
Trial - trendoscope.io/trial
Subscribe - trendoscope.io/pricing
Blog - docs.trendoscope.io
Subscribe - trendoscope.io/pricing
Blog - docs.trendoscope.io
Declinazione di responsabilità
Le informazioni e le pubblicazioni non sono intese come, e non costituiscono, consulenza o raccomandazioni finanziarie, di investimento, di trading o di altro tipo fornite o approvate da TradingView. Per ulteriori informazioni, consultare i Termini di utilizzo.