OPEN-SOURCE SCRIPT
ATR adjusted MACD
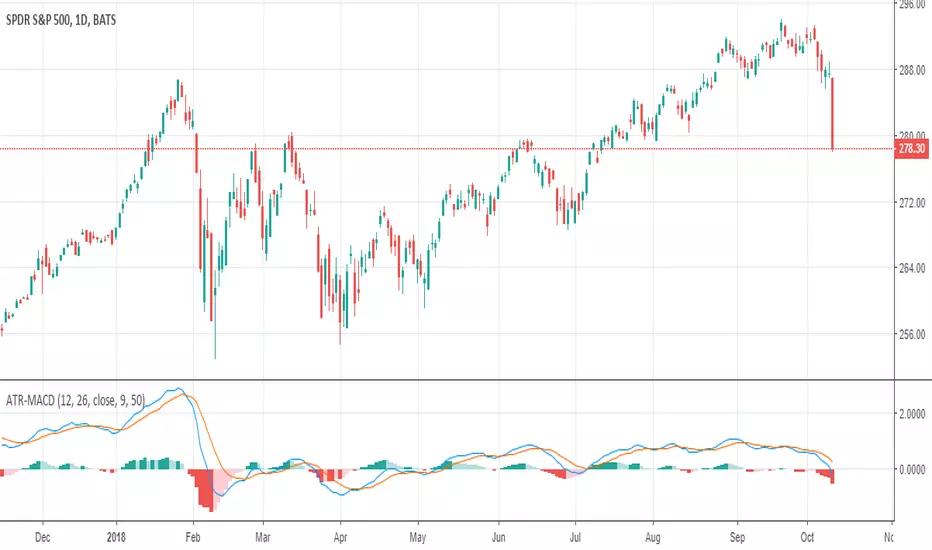
When running MACD, it can be useful to compare the value of the MA difference to other values. In other words, is a particular stock or futures contract at a more extreme MACD value than another. This can be done by dividing by the price, however, that doesn't adjust for volatility differences. Using ATR, one can adjust for price and volatility at the same time, allowing comparisons between securities more easily.
Script open-source
In pieno spirito TradingView, il creatore di questo script lo ha reso open-source, in modo che i trader possano esaminarlo e verificarne la funzionalità. Complimenti all'autore! Sebbene sia possibile utilizzarlo gratuitamente, ricorda che la ripubblicazione del codice è soggetta al nostro Regolamento.
Declinazione di responsabilità
Le informazioni ed i contenuti pubblicati non costituiscono in alcun modo una sollecitazione ad investire o ad operare nei mercati finanziari. Non sono inoltre fornite o supportate da TradingView. Maggiori dettagli nelle Condizioni d'uso.