PROTECTED SOURCE SCRIPT
Cross-Asset Risk Appetite Index
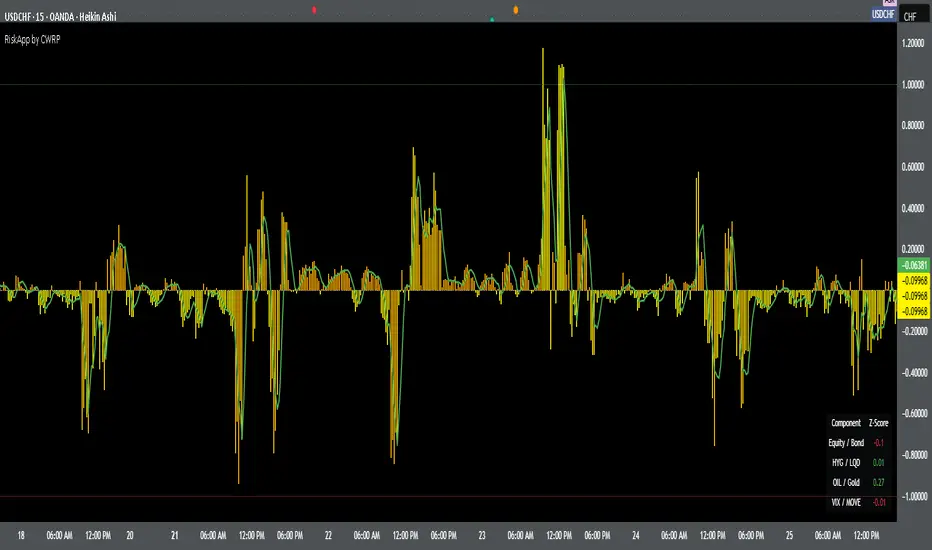
Cross-Asset Risk Appetite Index (RiskApp) by CWRP combines multiple asset classes into a single risk sentiment signal to help traders and investors detect when the market is in a risk-on or risk-off regime.
It calculates a composite Z-score index based on relative performance between:
SPY / IEF: Equities vs Bonds
HYG / LQD: High Yield vs Investment Grade Credit
CL / GC: Oil vs Gold
VIX / MOVE: Equity vs Bond Market Volatility (inverted)
Each component reflects capital flows toward riskier or safer assets, with dynamic weighting (Equity/Bond: 30%, Credit: 25%, Commodities: 25%, Volatility: 20%) and smoothing applied for a cleaner signal.
How to Read:
Highlighting
Yellow = Risk-On sentiment (market favors risk assets)
Orange = Risk-Off sentiment (flight to safety)
Black Background = Neutral design for emotional detachment
Table
Equity/Bond Z-Score:
Positive (> +1) --> Stocks outperforming bonds --> Risk-On
Negative (< -1) --> Bonds outperforming stocks --> Risk-Off
Credit Spread Z-Score (HYG/LQD):
Positive --> High yield outperforming --> Investors seeking yield
Negative --> Flight to quality --> Credit concerns
Oil/Gold Z-Score:
Positive --> Oil outperforming --> Economic optimism
Negative --> Gold outperforming --> Defensive positioning
Volatility Spread (VIX/MOVE):
Positive --> Equity vol falling relative to bond vol --> Risk stabilizing
Negative --> Equity vol rising --> Caution / Risk-Off
Composite Index:
> +1 --> Strong Risk Appetite
< -1 --> Strong Risk Aversion
Between -1 and +1 --> Neutral regime
Thank you for using the Cross-Asset Risk Appetite Index by CWRP!
I'm open to all critiques and discussion around macro-finance and hope this model adds clarity to your decision-making.
Script protetto
Questo script è pubblicato come codice protetto. Tuttavia, è possibile utilizzarle liberamente e senza alcuna limitazione – ulteriori informazioni qui.
Declinazione di responsabilità
Le informazioni e le pubblicazioni non sono intese come, e non costituiscono, consulenza o raccomandazioni finanziarie, di investimento, di trading o di altro tipo fornite o approvate da TradingView. Per ulteriori informazioni, consultare i Termini di utilizzo.