OPEN-SOURCE SCRIPT
Volume Buy/Sell Chart
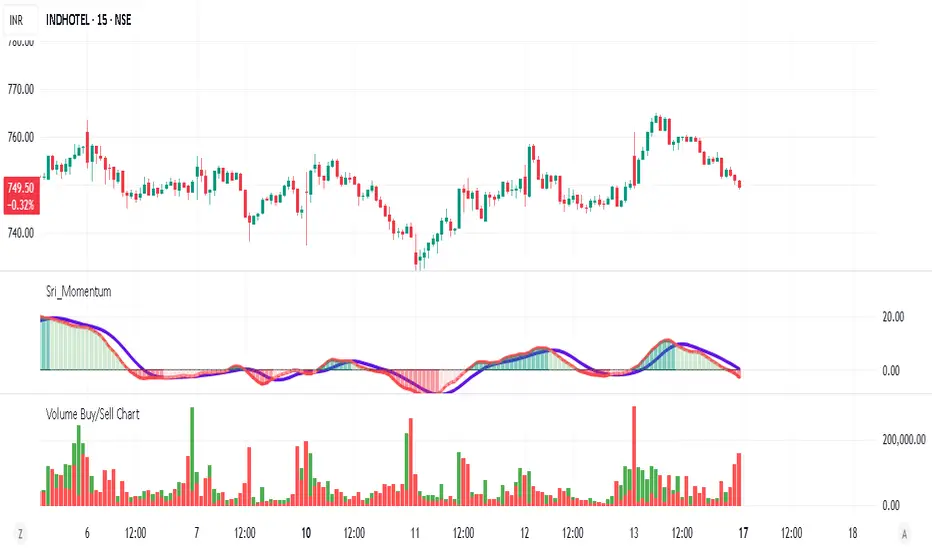
Volume Buy/Sell Chart
This script visualizes the distribution of buying and selling volume within each candlestick, helping traders identify dominant market pressure at a glance. It separates volume into Buy Volume (Green) and Sell Volume (Red) using a unique calculation based on price movement within a candle.
Features:
✅ Customizable Bar Display: Choose to display 5, 10, or 100 bars using a simple dropdown selection.
✅ Buy & Sell Volume Calculation: The script determines buying and selling volume dynamically based on price action within the candle.
✅ Custom Volume Threshold for Alerts: Set a percentage threshold (0–100) to trigger alerts when buy or sell volume exceeds a predefined level.
✅ Color-Coded Histogram:
Green Bars: Represent the estimated buy volume.
Red Bars: Represent the estimated sell volume.
✅ Alerts Integration: Automatically detect strong buy or sell signals when the respective volume percentage exceeds your set threshold.
How It Works:
The script calculates total price movement within a candle.
It then estimates buying and selling volume ratios based on whether the price closes higher or lower than it opened.
Finally, it normalizes the buy/sell volume against the total volume and plots it as a column chart.
Usage Guide:
Add the script to your chart.
Select how many bars to display (5, 10, or 100).
Adjust the Custom Volume Percentage Threshold (default: 75%).
Watch for significant buy/sell volume imbalances that might indicate market turning points!
This tool is great for traders looking to analyze volume flow and market sentiment with a simple yet effective visualization. 🚀
Script open-source
Nello spirito di TradingView, l'autore di questo script lo ha reso open source, in modo che i trader possano esaminarne e verificarne la funzionalità. Complimenti all'autore! Sebbene sia possibile utilizzarlo gratuitamente, ricordiamo che la ripubblicazione del codice è soggetta al nostro Regolamento.
Declinazione di responsabilità
Le informazioni e le pubblicazioni non sono intese come, e non costituiscono, consulenza o raccomandazioni finanziarie, di investimento, di trading o di altro tipo fornite o approvate da TradingView. Per ulteriori informazioni, consultare i Termini di utilizzo.