PROTECTED SOURCE SCRIPT
Pinks Moving Average Significance

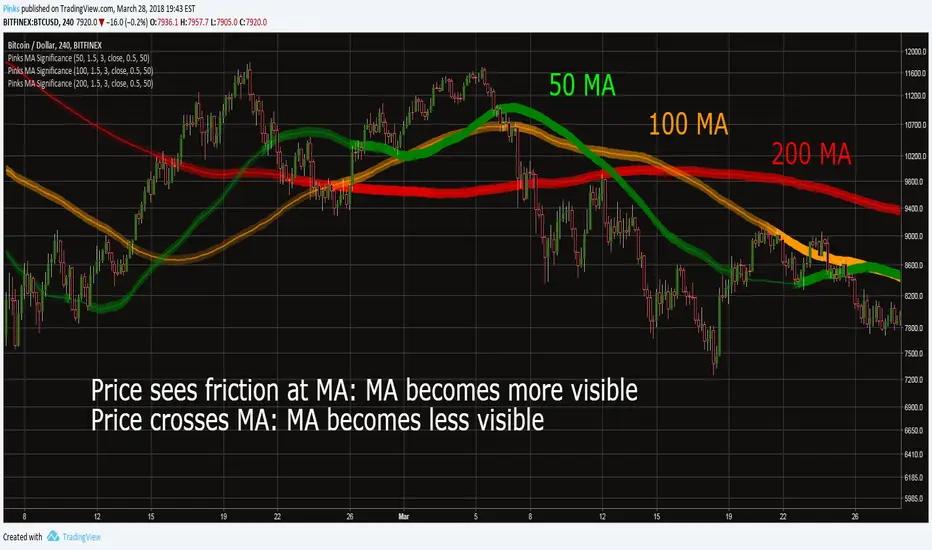
This indicator is meant as a means to assess the significance ("strength") of a Moving Average [MA], in other words how likely it is that price action is going to find support or resistance at the MA.
How it works
When the high or low of a candle is within the band around the MA defined by the "fuzziness" parameter, the significance of the MA increases proportional to how close the wick is to center of the band. When the price crosses fully through the band, its significance decreases. The strength will slowly decrease based on the "Lag Length" parameter.
The significance of the MA can be seen from the strength of its bands color.
How to use
MA Length: The length of the Moving Average.
Fuzziness[%]: Width of the MA band, in percent.
Lag Length: How slowly the MA strength changes.
Source: Source data for Moving Average.
SMA Cross Penalty: How strongly the strength of the MA is reduced when price crosses it. Recommended to leave at default value.
Full color at [%]: When the MA is at this percentage of its full strength, the color of the band will be completely opaque.
Script protetto
Questo script è pubblicato come codice protetto. Tuttavia, è possibile utilizzarle liberamente e senza alcuna limitazione – ulteriori informazioni qui.
Declinazione di responsabilità
Le informazioni e le pubblicazioni non sono intese come, e non costituiscono, consulenza o raccomandazioni finanziarie, di investimento, di trading o di altro tipo fornite o approvate da TradingView. Per ulteriori informazioni, consultare i Termini di utilizzo.