PROTECTED SOURCE SCRIPT
RSI with AVG MA'S -> PROFABIGHI_CAPITAL
🌟 Overview
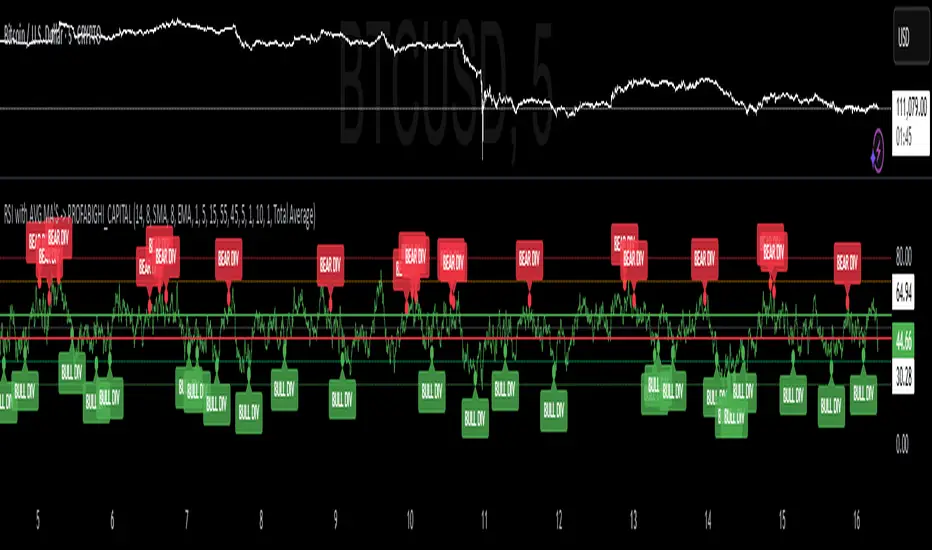
The RSI with AVG MAs → PROFABIGHI_CAPITAL indicator enhances traditional RSI analysis by layering moving averages across multiple timeframes, providing smoothed momentum signals and divergence detection for spotting overbought/oversold conditions and potential reversals. It allows traders to focus on averaged RSI values or individual components for clearer entry cues in trending or ranging markets.
⚙️ RSI & MA Settings
– RSI Period: Adjustable lookback for calculating relative strength across selected timeframes.
– MA1 Period & Type: Length and style for the first smoothing layer on RSI, with options from simple to advanced adaptive averages.
– MA2 Period & Type: Length and style for the second smoothing layer, enabling dual-filtered RSI views for reduced noise.
⏰ Timeframe Settings
– Timeframe 1, 2, 3: Select higher timeframes to aggregate RSI and MA data, creating a multi-resolution momentum overview.
📏 Level Settings
– Long Line: Customizable threshold for bullish momentum signals based on averaged RSI crossovers.
– Short Line: Customizable threshold for bearish momentum signals, aiding quick reversal identification.
🔍 Divergence Settings
– Pivot Lookback: Bars to scan for highs/lows in price and RSI for divergence patterns.
– Label Offset: Positioning adjustment for visual divergence markers.
– Divergence Pivot Detection Length: Sensitivity control for left-side pivot confirmation to balance signals.
– Divergence Pivot Confirmation Length: Right-side delay for fewer false positives in pattern validation.
– Plot Bullish/Bearish Divergences: Toggles for displaying upward (bullish) or downward (bearish) divergence alerts.
👁️ Display Options
– Display Option: Choose to show all lines, specific MAs, raw RSI, or the total average for customized chart focus.
📊 Multi-Timeframe Calculations
The indicator computes RSI on each selected timeframe, then applies chosen moving averages to smooth values, averaging them for a consensus signal that filters single-timeframe noise. Divergences are scanned by comparing price pivots against averaged RSI extremes, highlighting mismatches for reversal potential.
📈 Signal Generation
– Momentum Crossovers: Bullish cues when averages rise above the long line; bearish when dropping below the short line.
– Overbought/Oversold Alerts: Warnings for averages crossing extreme levels like 70 or 80 for caution, and 50 for directional shifts.
– Divergence Triggers: Bullish when price hits lower lows but RSI forms higher lows; bearish on price higher highs with RSI lower highs.
🔔 Alert Conditions
– MA & Total Average Alerts: Notifications for entries into danger zones (above 70/80) or health/sell zones (below 70/50).
– RSI Pressure Alerts: Signals for overbought pressure above 70 or selling momentum below 50.
– Divergence Alerts: Specific messages for bullish or bearish patterns, including price and RSI value details.
📉 Visualization
– Averaged Lines: Color-coded plots for individual timeframes, MAs, RSI, or totals, with options to isolate views.
– Horizontal Levels: Dotted lines at standard extremes (80/70/50/35/25) and solid custom lines for long/short thresholds.
– Divergence Markers: Circle plots at pivot points, with labeled boxes detailing price/RSI comparisons for quick scans.
– Flexible Display: Toggle between full clutter or streamlined averages to suit analysis style.
✅ Key Takeaways
– Multi-timeframe RSI smoothing uncovers reliable momentum without single-frame whipsaws.
– Dual MAs and averages provide layered confirmation for crossovers and extremes.
– Built-in divergences add reversal edge, with alerts for hands-free monitoring.
– Customizable views and levels adapt to any timeframe or trading approach.
Script protetto
Questo script è pubblicato come codice protetto. Tuttavia, è possibile utilizzarlo liberamente e senza alcuna limitazione – per saperne di più clicca qui.
Declinazione di responsabilità
Le informazioni ed i contenuti pubblicati non costituiscono in alcun modo una sollecitazione ad investire o ad operare nei mercati finanziari. Non sono inoltre fornite o supportate da TradingView. Maggiori dettagli nelle Condizioni d'uso.