OPEN-SOURCE SCRIPT
Buy And Hold Performance Screener - [JTCAPITAL]
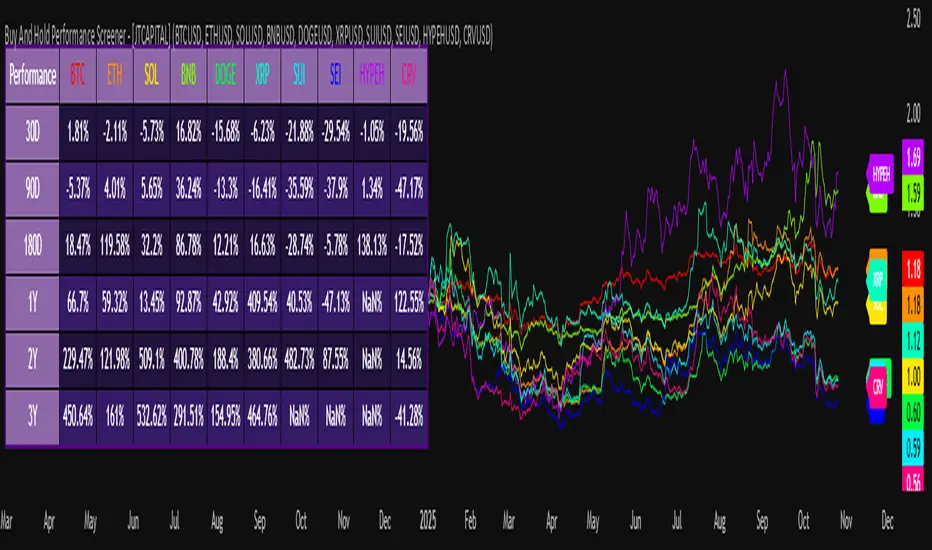
Buy And Hold Performance Screener – [JTCAPITAL] is a script designed to track and display multi-asset “buy and hold” performance curves and performance statistics over defined timeframes for selected symbols. It doesn’t attempt to time entries or exits; rather, it shows what would happen if one simply bought the asset at the defined start date and held it.
The indicator works by calculating in the following steps:
The indicator works by calculating in the following steps:
- Start Date Definition
The script begins by reading an input for the start date. This defines the bar from which the equity curves begin. - Symbol Definitions & Close Price Retrieval
The script allows the user to specify up to ten tickers. For each ticker it uses request.security() on the “1D” timeframe to retrieve the daily close price of that symbol. - Plot Enable Inputs
For each ticker there is an input boolean controlling whether the equity curve for that ticker should be plotted. - Asset Name Cleaning
The helper function clean_name(string asset) => … takes the asset string (e.g., “CRYPTO:SOLUSD”) and manipulates it (via string splitting and replacements) to derive a cleaned short name (e.g., “SOL”). This name is used for visuals (labels, table headers). - Equity Curve Calculation (“HODL”)
The helper function f_HODL(closez) defines a variable equity that assumes a starting equity of 1 unit at the start date and then multiplies by the ratio of each bar’s close to the prior bar’s close: i.e. daily compounding of returns. - Performance Metrics Calculation
The helper function f_performance(closez) calculates, for each symbol’s close series, the percentage change of the current close relative to its close 30 days ago, 90 days ago, 180 days ago, 1 year ago (365 days), 2 years ago (730 days) and 3 years ago (1095 days). - Equity Curve Plots
For each ticker, if the corresponding plot input is true, the script assigns a plotted variable equal to the equity curve value. Its then drawing each selected equity curve on the chart, each in a distinct color. - Table Construction
If the plottable input is true, the script constructs a table and populates it with rows and column corresponding to the assigned tickers and the set 6 timeframes used for display.
Buy and Sell Conditions:
Since this is strictly a “buy-and-hold” performance screener, there are no explicit buy or sell signals generated or plotted. The script assumes: buy at the defined start_date, hold continuously to present. There are no filters, no exit logic, no take-profit or stop-loss. The benefit of this approach is to provide a clean benchmark of how selected assets would have performed if one simply adopted a passive “buy & hold” approach from a given start date.
Features and Parameters:start_date (input.time): Defines the date from which performance and equity curves begin.
ticker1 … ticker10 (input.symbol): User-selectable asset symbols to include in the screener.
plot1 … plot10 (input.bool): Boolean flags to enable/disable plotting of each asset’s equity curve.
plottable (input.bool): Flag to enable/disable drawing the performance table.
Colored plotting + Labels for identifying each asset curve on the chart.Specifications:
Here is a detailed breakdown of every calculation/variable/function used in the script and what each part means:
start_date
This is defined via input.time(timestamp("1 Jan 2025"), title = "Start Date"). It allows the user to pick a specific calendar date from which the equity curves and performance calculations will start.
ticker1 … ticker10
These inputs allow the user to select up to ten different assets (symbols) to monitor. The script uses each of these to fetch daily close prices.
plot1 … plot10
Boolean inputs controlling which of the ten asset equity curves are plotted. If plotX is true, the equity curve for ticker X will be visible; otherwise it will be not plotted. This gives the user flexibility to include or exclude specific assets on the chart.
Returns the cleaned asset short name.
This provides friendly text labels like “BTC”, “ETH”, “SOL”, etc., instead of full symbol codes.
The choice of distinct colours for each asset helps differentiate curves visually when multiple assets are overlaid.
Colour definitions
Variables color1…color10 are explicitly defined via color.rgb(r,g,b) to give each asset a unique colour (e.g., red, orange, yellow, green, cyan, blue, purple, pink, etc.).
What are the benefits of combining these calculations?
By computing equity curves for multiple assets from the same start date and overlaying them, you can visualise comparative performance of different assets under a uniform “buy & hold” assumption.
The performance table adds multi-horizon returns (30 D, 90 D, 180 D, 1 Y, 2 Y, 3 Y) which helps the user see both short-term and longer-term performance without having to manually compute returns.
The use of daily close data via request.security(..., "1D") removes dependency on the chart’s timeframe, thereby standardising the comparison across assets.
The equity curve and table together provide both visual (curve) and numerical (table) summaries of performance, making it easier to spot trends, divergences, and cross-asset comparisons at a glance.
Because it uses compounding (equity := equity * (closez / closez[1])), the curves reflect the real growth of a 1-unit investment held over time, rather than only simple returns.
The labelling of curves and the color-coding make the multi-asset overlay easier to interpret.
Using a clean start date ensures that all curves begin at the same point (1 unit at start_date), making relative performance intuitive.
Because of this, the script is useful as a benchmarking tool: rather than trying to pick entries or exit points, you can simply compare “what if I had held these assets since Jan 1 2025” (or your chosen date), and see which assets out-/under-performed in that period. It helps an investor or trader evaluate the long-term benefits of passive vs. active management, or of allocation decisions.
Please note:
The script assumes continuous daily data and does not account for dividends, fees, slippage, or tax implications.
It does not attempt to optimise timing or provide trading signals.
Returns prior to the start date are ignored (equity only begins once time >= start_date).
For newly listed assets with fewer than 365 or 730 or 1095 days of history, the longer-horizon returns may return na or misleading values.
Because it uses request.security() without specifying lookahead, and on “1D” timeframe, it complies with standard usage but you should verify there is no look-ahead bias in your particular setup.
ENJOY!
Script open-source
Nello spirito di TradingView, l'autore di questo script lo ha reso open source, in modo che i trader possano esaminarne e verificarne la funzionalità. Complimenti all'autore! Sebbene sia possibile utilizzarlo gratuitamente, ricordiamo che la ripubblicazione del codice è soggetta al nostro Regolamento.
Declinazione di responsabilità
Le informazioni e le pubblicazioni non sono intese come, e non costituiscono, consulenza o raccomandazioni finanziarie, di investimento, di trading o di altro tipo fornite o approvate da TradingView. Per ulteriori informazioni, consultare i Termini di utilizzo.