PROTECTED SOURCE SCRIPT
A best Seasonality Monthly Indicator
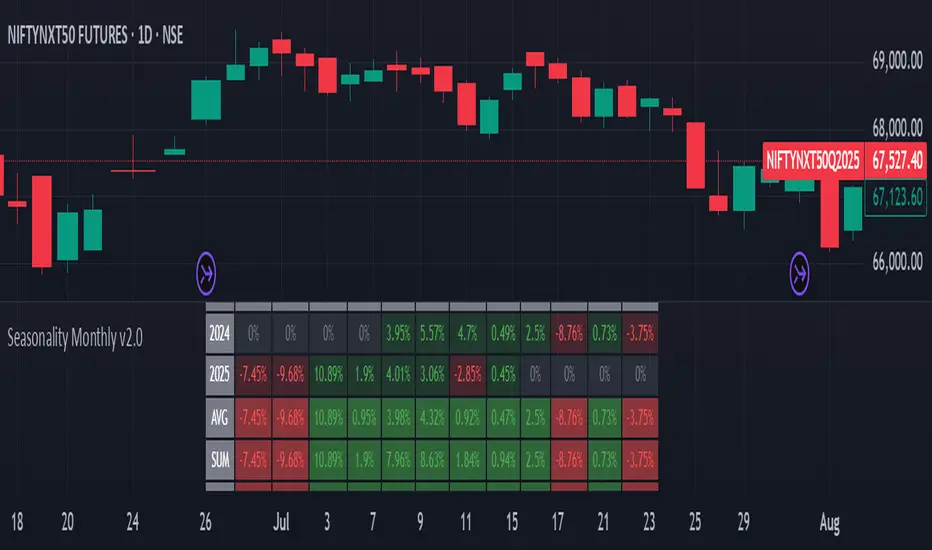
Seasonality Monthly is a custom indicator designed for TradingView that calculates and displays monthly seasonality performance as a table overlay on the chart.
Key aspects and functionality:
It requires the timeframe to be either monthly or daily; otherwise, it throws an error.
The user can set the starting year (default 2015) from which the seasonality statistics begin.
It collects monthly percentage change data (close to close returns) for each month and year dynamically using request.security.
Data is stored in a two-dimensional matrix representing years by months, accumulating returns for each month over the years.
The table is drawn on the chart showing monthly returns for each year, with cells colored green for positive returns and red for negatives.
The bottom rows of the table show summary statistics per month:
AVG: Average monthly returns
SUM: Sum of returns
+ive: Count of months with positive returns over total counts
WR: Win rate (ratio of positive months)
Text sizes and colors are customizable via inputs.
Uses Pine Script v5 features like matrix, table API, and new runtime error handling.
This script is useful for visualizing historical monthly seasonality patterns for any symbol on TradingView.
------------------
The Seasonality Monthly Pine Script indicator is a powerful tool designed for TradingView that enables traders to analyze and visualize the historical seasonal performance of an asset on a monthly basis. This script focuses on identifying recurring monthly patterns by accumulating monthly percentage returns over multiple years, providing insights that help traders understand when certain months tend to perform better or worse historically.
The script requires the chart to be set to either a daily or monthly timeframe to ensure accurate calculations and data retrieval. It uses the request. security function to fetch monthly data, extracting each bar's year, month, and monthly price change percent based on close-to-close returns. These returns are then accumulated into a matrix data structure, organizing the percentage changes for each year and month to build a comprehensive historical dataset.
A dynamic table is constructed and displayed on the chart, showing a detailed breakdown of percentage changes each month for every year starting from a customizable start year (default is 2015). Each cell in the table is color-coded—green for positive monthly returns and red for negative—making it visually easy to interpret seasonal trends. This immediate visual feedback is valuable for traders looking to identify strong or weak months historically.
Beyond just the yearly data, the script calculates aggregate statistics for each month, which are displayed in summary rows at the bottom of the table. These include the average monthly return, the sum of returns, the count of positive-return months versus total months ("+ive"), and the win rate (WR), which is the proportion of positive months over the total number of months observed. These statistics assist traders in quantifying the strength and consistency of monthly seasonal effects.
The script also includes user customization options such as the starting year for seasonality analysis and adjustable text size for better readability. It incorporates modern Pine Script v5 features like runtime error handling, matrix operations, and the enhanced table API for efficient and clear display.
Overall, This is a practical indicator that helps traders incorporate seasonality insights into their decision-making process, potentially improving timing entries and exits by leveraging historical monthly market behaviors. It is particularly useful for spotting cyclic tendencies and planning strategies around historically strong or weak months, adding a valuable dimension to technical analysis.
----------------------------------------------
#Seasonality #TradingView #PineScript #TechnicalAnalysis #StockMarket #MonthlyPerformance #SeasonalTrends #MarketAnalysis #TradingStrategy #PricePatterns #Charting #DataVisualization #AlgorithmicTrading #FinancialMarkets #TradingIndicators #InvestmentStrategy #QuantitativeAnalysis #MarketSeasonality #StockTrading #TradingTools
Script protetto
Questo script è pubblicato come codice protetto. Tuttavia, è possibile utilizzarle liberamente e senza alcuna limitazione – ulteriori informazioni qui.
Declinazione di responsabilità
Le informazioni e le pubblicazioni non sono intese come, e non costituiscono, consulenza o raccomandazioni finanziarie, di investimento, di trading o di altro tipo fornite o approvate da TradingView. Per ulteriori informazioni, consultare i Termini di utilizzo.