OPEN-SOURCE SCRIPT
Supply & Demand Zones (by Wali Afridi)
Description:
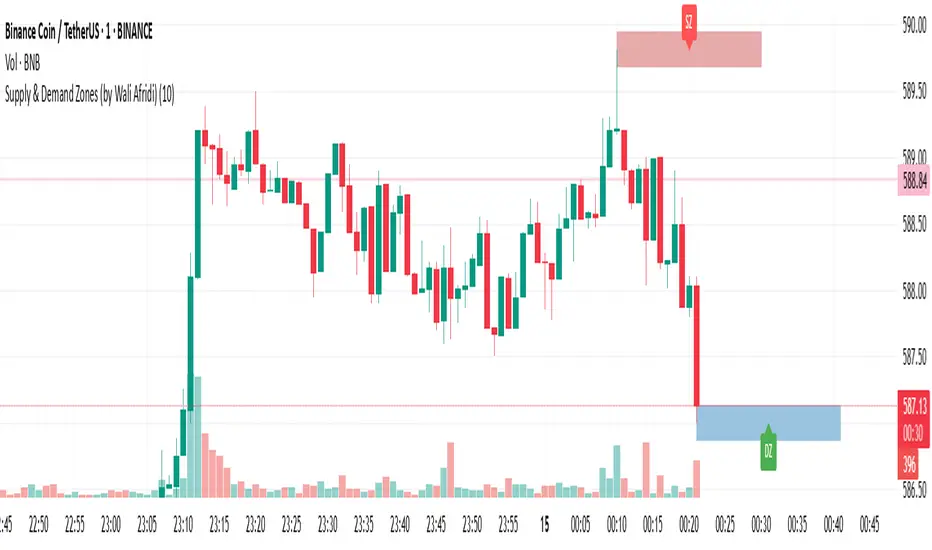
🚀 This indicator accurately detects Supply & Demand Zones by identifying swing highs and lows. It plots a single clean line for each zone and labels them as "SZ" (Supply Zone) and "DZ" (Demand Zone), ensuring a clear and minimalistic chart.
🔹 Features:
✅ Auto-detects recent Supply & Demand Zones
✅ Plots clean horizontal lines for the latest zones
✅ Displays "SZ" above the supply line & "DZ" below the demand line
✅ No duplicate labels—only one label per zone
✅ Minimal & clutter-free visualization
How to Use:
1️⃣ Add the indicator to your chart
2️⃣ Watch for Supply Zones (SZ) appearing above red lines – These indicate potential resistance areas where price may reverse or consolidate.
3️⃣ Watch for Demand Zones (DZ) appearing below green lines – These indicate strong support areas where price may bounce.
4️⃣ Use with other confirmations (Price Action, SMC, Volume) for better accuracy.
⚠️ Disclaimer:
This script is for educational purposes only and should not be considered financial advice. Always backtest and use risk management before applying it to live trading.
Script open-source
Nello spirito di TradingView, l'autore di questo script lo ha reso open source, in modo che i trader possano esaminarne e verificarne la funzionalità. Complimenti all'autore! Sebbene sia possibile utilizzarlo gratuitamente, ricordiamo che la ripubblicazione del codice è soggetta al nostro Regolamento.
Declinazione di responsabilità
Le informazioni e le pubblicazioni non sono intese come, e non costituiscono, consulenza o raccomandazioni finanziarie, di investimento, di trading o di altro tipo fornite o approvate da TradingView. Per ulteriori informazioni, consultare i Termini di utilizzo.