OPEN-SOURCE SCRIPT
Aggiornato Risk Metrics: beta 'β', correl 'ρxy', stdev 'σ', variance 'σ²'
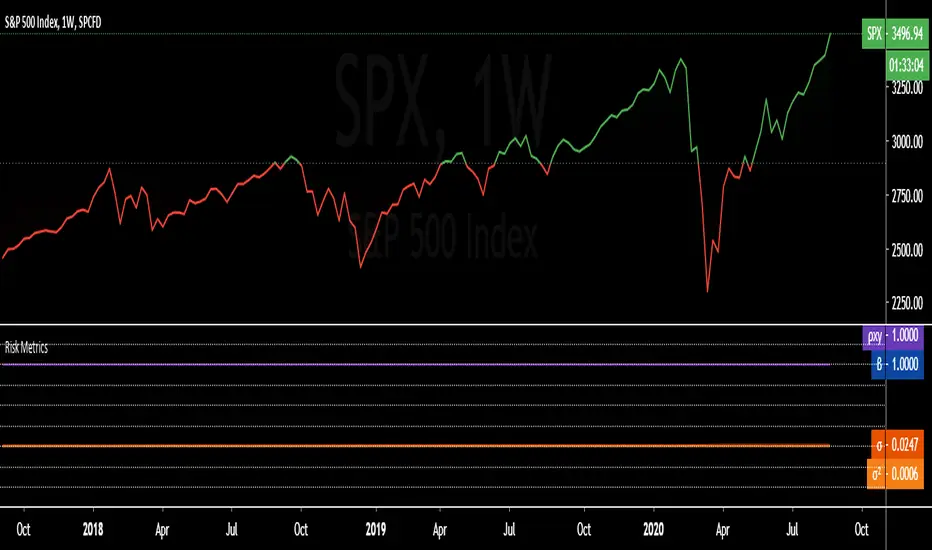
Portfolio Risk Metrics (Part I):
beta 'β'
The beta coefficient can be interpreted as follows:
β =1 exactly as volatile as the market
β >1 more volatile than the market
β <1>0 less volatile than the market
β =0 uncorrelated to the market
β <0 negatively correlated to the market
excerpt from the Corporate Finance Institute
correlation coefficient 'ρxy'
The correlation coefficient is a value that indicates the strength of the relationship between variables.
The coefficient can take any values from -1 to 1. The interpretations of the values are:
-1: Perfect negative correlation. The variables tend to move in opposite directions
(i.e., when one variable increases, the other variable decreases).
0: No correlation. The variables do not have a relationship with each other.
1: Perfect positive correlation. The variables tend to move in the same direction
(i.e., when one variable increases, the other variable also increases).
excerpt from the Corporate Finance Institute
standard deviation 'σ'
68% of returns will fall within 1 standard deviation of the arithmetic mean
95% of returns will fall within 2 standard deviations of the arithmetic mean
99% of returns will fall within 3 standard deviations of the arithmetic mean
excerpt from Corporate Finance Institute
variance 'σ²'
In investing, variance is used to compare the relative performance of each asset in a portfolio.
Because the results can be difficult to analyze, standard deviation is often used instead of variance.
In either case, the goal for the investor is to improve asset allocation.
excerpt from Investopedia
Note di rilascio
Conversion from percentages to decimals for better plot/visualization consistency. Added ρxy² (correlation squared).
Script open-source
Nello spirito di TradingView, l'autore di questo script lo ha reso open source, in modo che i trader possano esaminarne e verificarne la funzionalità. Complimenti all'autore! Sebbene sia possibile utilizzarlo gratuitamente, ricordiamo che la ripubblicazione del codice è soggetta al nostro Regolamento.
Declinazione di responsabilità
Le informazioni e le pubblicazioni non sono intese come, e non costituiscono, consulenza o raccomandazioni finanziarie, di investimento, di trading o di altro tipo fornite o approvate da TradingView. Per ulteriori informazioni, consultare i Termini di utilizzo.