OPEN-SOURCE SCRIPT
Aggiornato Single Prints - Bright
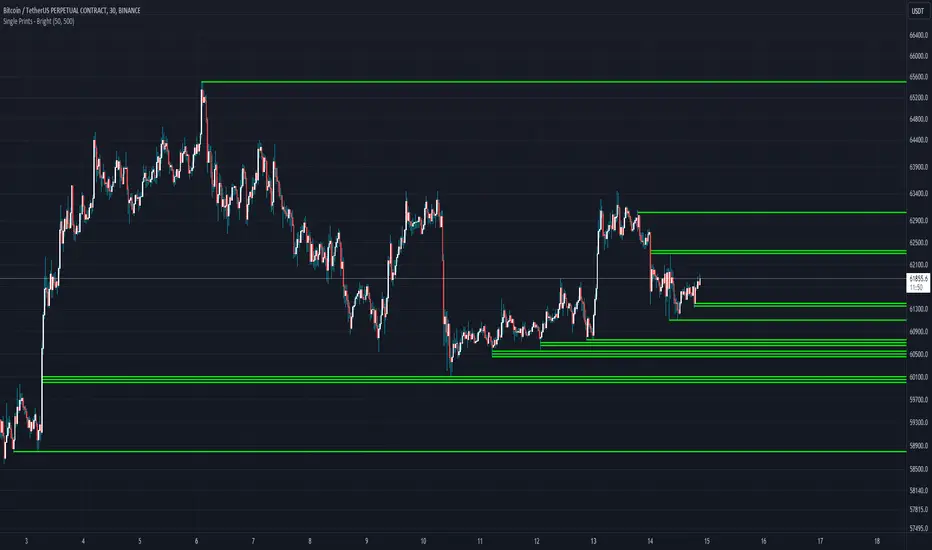
Single Prints - Bright is a Pine Script indicator designed to identify and visualize significant price levels based on the concept of "single prints." Single prints are price levels where trading activity occurred but with little or no follow-up trading. This indicator plots these levels as lines on the chart, allowing traders to easily identify areas of potential support and resistance.
Features:
Customizable Line Distance: Adjust the distance between single print lines to suit your trading style and time frame.
Maximum Array Size: Set the maximum number of single print lines to be displayed on the chart.
Remove Gaps: Option to remove lines if the price gaps over them.
Multiple Time Frames: Choose to display single prints for daily, weekly, monthly, or yearly sessions.
Color Gradient: Lines are color-coded from red (oldest) to green (newest), providing a visual indication of their relative age.
Thicker, Lime-Colored Lines: Improved visibility with thicker lines and a more lime-like color scheme for easier identification on the chart.
How to Use:
Adding the Indicator:
Open TradingView and navigate to the chart where you want to apply the indicator.
Click on "Indicators" in the top menu.
Select "Pine Editor" and paste the provided Pine Script code into the editor.
Click "Add to Chart" to apply the indicator to your chart.
Configuring the Indicator:
Distance Between Lines (i_line_distance): Set the distance between single print lines. Adjust this value based on the volatility and time frame of the asset you are trading.
Maximum Array Size (i_max_array): Define the maximum number of single print lines to be displayed on the chart. This helps in managing the clutter on the chart.
Remove Gaps (i_remove_gaps): Enable or disable the option to remove lines if the price gaps over them.
Show Daily Single Prints (ShowDailySP): Enable or disable the display of daily single print lines.
Show Daily Extended Single Prints (ShowDailyExtendSP): Enable or disable the display of extended daily single print lines.
Show Weekly Single Prints (ShowWeeklySP): Enable or disable the display of weekly single print lines.
Show Monthly Single Prints (ShowMonthlySP): Enable or disable the display of monthly single print lines.
Show Yearly Single Prints (ShowYearlySP): Enable or disable the display of yearly single print lines.
Interpreting the Lines:
Color Gradient: The lines are color-coded to indicate their relative age. Red lines are the oldest, transitioning through orange and yellow to green, which are the newest. This color gradient helps in identifying how long a particular level has been significant.
Support and Resistance: Use the lines as potential support and resistance levels. Multiple lines close together indicate stronger levels of support or resistance.
Volatility Analysis: The number of lines within a gap can provide insights into market volatility. More lines indicate higher volatility and multiple potential reversal points within that range.
Trading Strategies:
Entry Points: Consider using the single print lines as entry points. For example, if the price approaches a support level with multiple lines, it may be a good buying opportunity.
Stop Loss and Take Profit: Use the single print lines to set stop-loss and take-profit levels. Placing stop-loss orders below multiple support lines can provide additional protection.
Trend Analysis: Analyze the overall trend and momentum in conjunction with the single print lines to make informed trading decisions. If the price is in an uptrend and approaching resistance lines, watch for potential breakouts or reversals.
Note di rilascio
Single Prints - Bright is a Pine Script indicator designed to identify and visualize significant price levels based on the concept of "single prints." Single prints are price levels where trading activity occurred but with little or no follow-up trading. This indicator plots these levels as lines on the chart, allowing traders to easily identify areas of potential support and resistance.Features:
Customizable Line Distance: Adjust the distance between single print lines to suit your trading style and time frame.
Maximum Array Size: Set the maximum number of single print lines to be displayed on the chart.
Remove Gaps: Option to remove lines if the price gaps over them.
Multiple Time Frames: Choose to display single prints for daily, weekly, monthly, or yearly sessions. BEST ON 30 MIN
Thicker, Lime-Colored Lines: Improved visibility with thicker lines and a more lime-like color scheme for easier identification on the chart.
How to Use:
Adding the Indicator:
Open TradingView and navigate to the chart where you want to apply the indicator.
Click on "Indicators" in the top menu.
Select "Pine Editor" and paste the provided Pine Script code into the editor.
Click "Add to Chart" to apply the indicator to your chart.
Configuring the Indicator:
Distance Between Lines (i_line_distance): Set the distance between single print lines. Adjust this value based on the volatility and time frame of the asset you are trading.
Maximum Array Size (i_max_array): Define the maximum number of single print lines to be displayed on the chart. This helps in managing the clutter on the chart.
Remove Gaps (i_remove_gaps): Enable or disable the option to remove lines if the price gaps over them.
Show Daily Single Prints (ShowDailySP): Enable or disable the display of daily single print lines.
Show Daily Extended Single Prints (ShowDailyExtendSP): Enable or disable the display of extended daily single print lines.
Show Weekly Single Prints (ShowWeeklySP): Enable or disable the display of weekly single print lines.
Show Monthly Single Prints (ShowMonthlySP): Enable or disable the display of monthly single print lines.
Show Yearly Single Prints (ShowYearlySP): Enable or disable the display of yearly single print lines.
Interpreting the Lines:
Entry Points: Consider using the single print lines as entry points. For example, if the price approaches a support level with multiple lines, it may be a good buying opportunity.
Stop Loss and Take Profit: Use the single print lines to set stop-loss and take-profit levels. Placing stop-loss orders below multiple support lines can provide additional protection.
Trend Analysis: Analyze the overall trend and momentum in conjunction with the single print lines to make informed trading decisions. If the price is in an uptrend and approaching resistance lines, watch for potential breakouts or reversals.
Script open-source
Nello spirito di TradingView, l'autore di questo script lo ha reso open source, in modo che i trader possano esaminarne e verificarne la funzionalità. Complimenti all'autore! Sebbene sia possibile utilizzarlo gratuitamente, ricordiamo che la ripubblicazione del codice è soggetta al nostro Regolamento.
Declinazione di responsabilità
Le informazioni e le pubblicazioni non sono intese come, e non costituiscono, consulenza o raccomandazioni finanziarie, di investimento, di trading o di altro tipo fornite o approvate da TradingView. Per ulteriori informazioni, consultare i Termini di utilizzo.