OPEN-SOURCE SCRIPT
Fourier Spectrometer of Price w/ Extrapolation Forecast [Loxx]
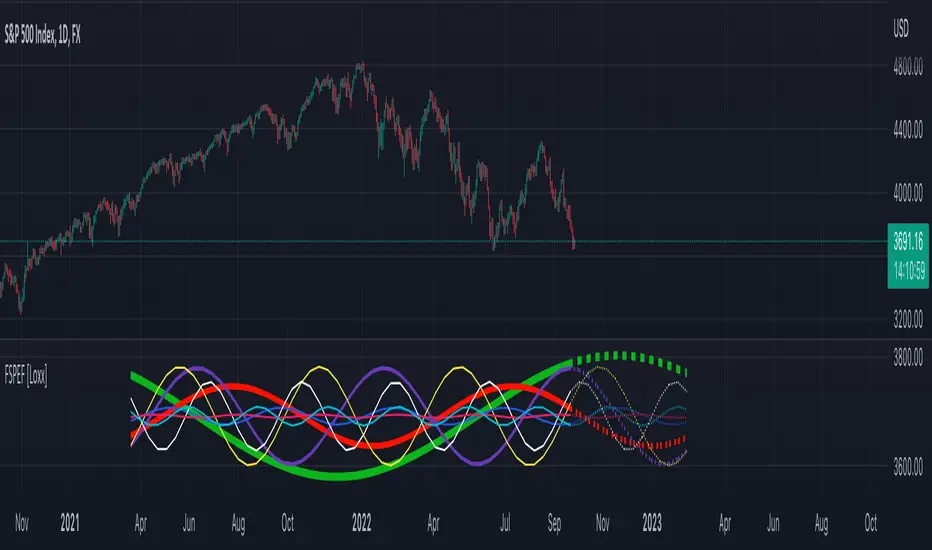
Fourier Spectrometer of Price w/ Extrapolation Forecast [Loxx] is a forecasting indicator that forecasts the sinusoidal frequency of input price. This method uses Linear Regression with a Fast Fourier Transform function for the forecast and is different from previous forecasting methods I've posted. Dotted lines are the forecast frequencies. You can change the UI colors and line widths. This comes with 8 frequencies out of the box. Instead of drawing sinusoidal manually on your charts, you can use this instead. This will render better results than eyeballing the Sine Wave that folks use for trading. this is the real math that automates that process.
Each signal line can be shown as a linear superposition of periodic (sinusoidal) components with different periods (frequencies) and amplitudes. Roughly, the indicator shows those components. It strongly depends on the probing window and changes (recalculates) after each tick; e.g., you can see the set of frequencies showing whether the signal is fast or slow-changing, etc. Sometimes only a small number of leading / strongest components (e.g., 3) can extrapolate the signal quite well.
Related Indicators
Fourier Extrapolator of 'Caterpillar' SSA of Price [Loxx]
![Fourier Extrapolator of 'Caterpillar' SSA of Price [Loxx]](https://s3.tradingview.com/u/uxwDL6xK_mid.png)
Real-Fast Fourier Transform of Price w/ Linear Regression [Loxx]
![Real-Fast Fourier Transform of Price w/ Linear Regression [Loxx]](https://s3.tradingview.com/1/19wyKiYV_mid.png)
Fourier Extrapolator of Price w/ Projection Forecast [Loxx]
![Fourier Extrapolator of Price w/ Projection Forecast [Loxx]](https://s3.tradingview.com/u/u0r2gpti_mid.png)
Itakura-Saito Autoregressive Extrapolation of Price [Loxx]
![Itakura-Saito Autoregressive Extrapolation of Price [Loxx]](https://s3.tradingview.com/b/BKC6dFUY_mid.png)
Helme-Nikias Weighted Burg AR-SE Extra. of Price [Loxx]
![Helme-Nikias Weighted Burg AR-SE Extra. of Price [Loxx]](https://s3.tradingview.com/8/8YbmmPCn_mid.png)
***The period parameter doesn't correspond to how many bars back the drawing begins. Lines re rendered according to skipping mechanism due to TradingView limitations.
Each signal line can be shown as a linear superposition of periodic (sinusoidal) components with different periods (frequencies) and amplitudes. Roughly, the indicator shows those components. It strongly depends on the probing window and changes (recalculates) after each tick; e.g., you can see the set of frequencies showing whether the signal is fast or slow-changing, etc. Sometimes only a small number of leading / strongest components (e.g., 3) can extrapolate the signal quite well.
Related Indicators
Fourier Extrapolator of 'Caterpillar' SSA of Price [Loxx]
Real-Fast Fourier Transform of Price w/ Linear Regression [Loxx]
Fourier Extrapolator of Price w/ Projection Forecast [Loxx]
Itakura-Saito Autoregressive Extrapolation of Price [Loxx]
Helme-Nikias Weighted Burg AR-SE Extra. of Price [Loxx]
***The period parameter doesn't correspond to how many bars back the drawing begins. Lines re rendered according to skipping mechanism due to TradingView limitations.
Script open-source
In pieno spirito TradingView, il creatore di questo script lo ha reso open-source, in modo che i trader possano esaminarlo e verificarne la funzionalità. Complimenti all'autore! Sebbene sia possibile utilizzarlo gratuitamente, ricorda che la ripubblicazione del codice è soggetta al nostro Regolamento.
Public Telegram Group, t.me/algxtrading_public
VIP Membership Info: patreon.com/algxtrading/membership
VIP Membership Info: patreon.com/algxtrading/membership
Declinazione di responsabilità
Le informazioni ed i contenuti pubblicati non costituiscono in alcun modo una sollecitazione ad investire o ad operare nei mercati finanziari. Non sono inoltre fornite o supportate da TradingView. Maggiori dettagli nelle Condizioni d'uso.