PROTECTED SOURCE SCRIPT
Skew Detector
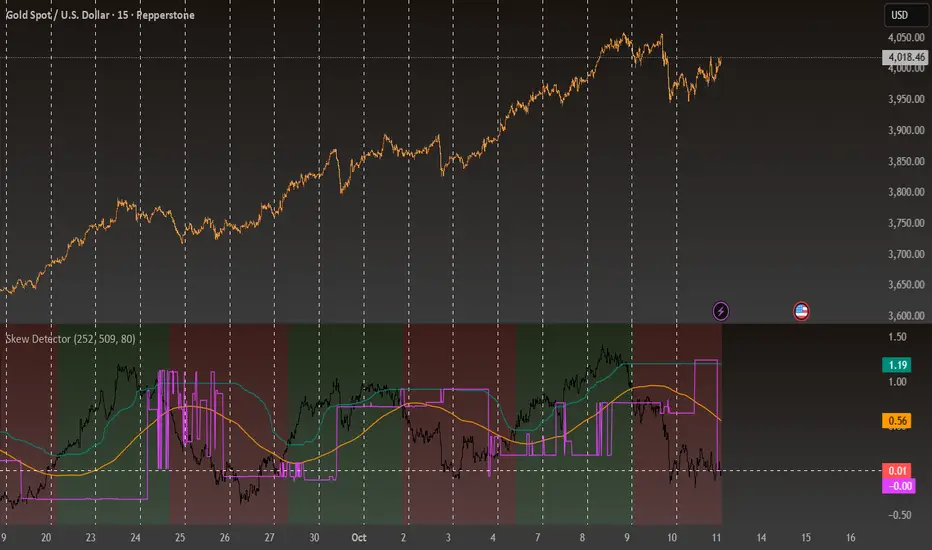
Skew Detector is a statistical bias analyzer designed to measure and visualize market asymmetry using range-based skewness.
It helps traders identify when price movements are stretching too far in one direction — signaling potential imbalance, exhaustion, or continuation bias in momentum.
The indicator computes three independent measures of skewness — mean, median, and mode — across a customizable lookback window. These are plotted as reference lines against a synthetic "skew candle" series, allowing you to visualize how current market skew compares to its historical distribution.
When the background turns green, it indicates that the market’s current skew is greater than all three reference measures — suggesting bullish dominance or upward distortion in price movement.
When it turns red, the opposite is true — signaling potential downside bias or negative skew.
Features
Measures mean, median, and mode of return-based skewness.
Highlights extreme bias conditions through dynamic background coloring.
Visualizes a synthetic skew candle series to track short-term fluctuations.
Fully customizable lookback length and histogram resolution.
Script protetto
Questo script è pubblicato come codice protetto. Tuttavia, è possibile utilizzarlo liberamente e senza alcuna limitazione – per saperne di più clicca qui.
Declinazione di responsabilità
Le informazioni ed i contenuti pubblicati non costituiscono in alcun modo una sollecitazione ad investire o ad operare nei mercati finanziari. Non sono inoltre fornite o supportate da TradingView. Maggiori dettagli nelle Condizioni d'uso.