OPEN-SOURCE SCRIPT
Sunset candles
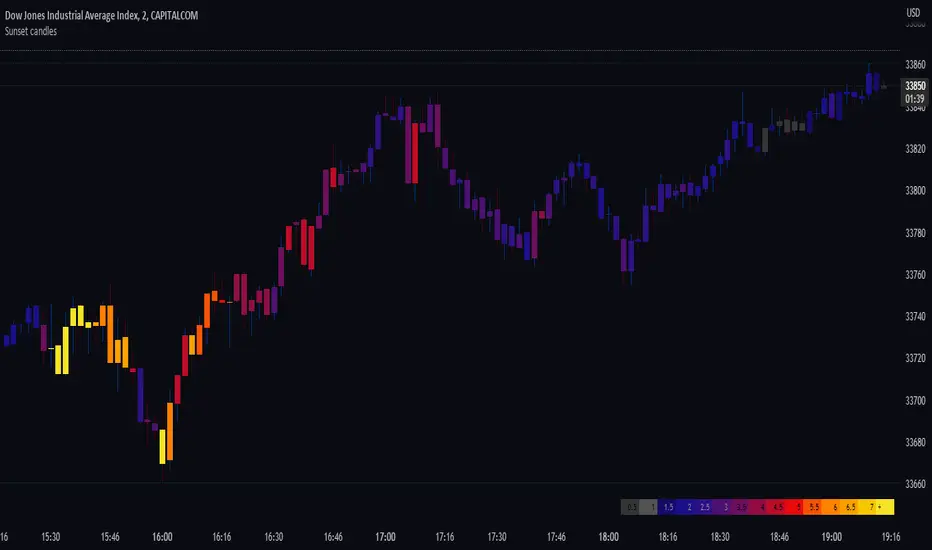
Displays the volume behind each candle with colors, to visualise their evolution over time, directly in the chart.
This indicator is best suited for dark mode (Suggested background color: #0a0c12).
The more intense is the color, the bigger is the volume.
The unit is a 400 periods moving average of the volume, considered as 1 volume.
Each color represents half of this volume. For ex: Grays indicate under (or equal) to the 400 MA (low volumes). Bright yellow represents above 7 times the 400 MA (very high volumes).
When there's no available volume datas, the candles turn bright green by default.
The wicks' colors stay the same, and can still indicate the direction of the candle.
In the settings, you can show/hide the gradient of the volume. By moving your chart over this gradient, it is possible to compare the candles to the colors, and read the corresponding volume number.
Script open-source
Nello spirito di TradingView, l'autore di questo script lo ha reso open source, in modo che i trader possano esaminarne e verificarne la funzionalità. Complimenti all'autore! Sebbene sia possibile utilizzarlo gratuitamente, ricordiamo che la ripubblicazione del codice è soggetta al nostro Regolamento.
Declinazione di responsabilità
Le informazioni e le pubblicazioni non sono intese come, e non costituiscono, consulenza o raccomandazioni finanziarie, di investimento, di trading o di altro tipo fornite o approvate da TradingView. Per ulteriori informazioni, consultare i Termini di utilizzo.