OPEN-SOURCE SCRIPT
Correlation Zones
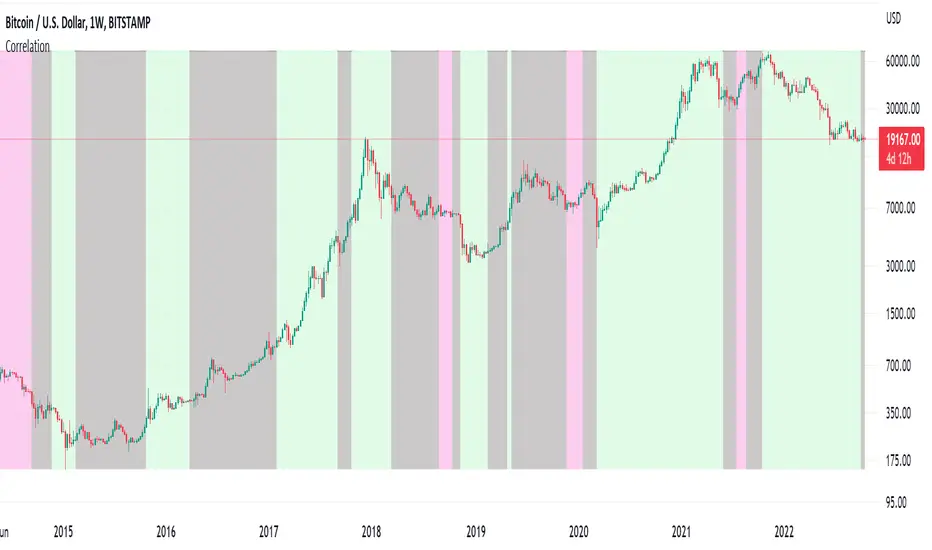
This indicator highlights zones with strong, weak and negative correlation. Unlike standard coefficient indicator it will help to filter out noise when analyzing dependencies between two assets.
With default input setting Correlation_Threshold=0.5:
- Zones with correlation above 0.5, will be colored in green (strong correlation)
- Zones with correlation from -0.5 to 0.5 will be colored grey (weak correlation)
- Zones with correlation below -0.5 will be colore red (strong negative correlation)
Input parameter "Correlation_Threshold" can be modified in settings.
Provided example demonstrates BTCUSD correlation with NASDAQ Composite . I advice to use weekly timeframe and set length to 26 week for this study
Script open-source
Nello spirito di TradingView, l'autore di questo script lo ha reso open source, in modo che i trader possano esaminarne e verificarne la funzionalità. Complimenti all'autore! Sebbene sia possibile utilizzarlo gratuitamente, ricordiamo che la ripubblicazione del codice è soggetta al nostro Regolamento.
Declinazione di responsabilità
Le informazioni e le pubblicazioni non sono intese come, e non costituiscono, consulenza o raccomandazioni finanziarie, di investimento, di trading o di altro tipo fornite o approvate da TradingView. Per ulteriori informazioni, consultare i Termini di utilizzo.