OPEN-SOURCE SCRIPT
[blackcat] L3 Fibonacci Bands With ATR
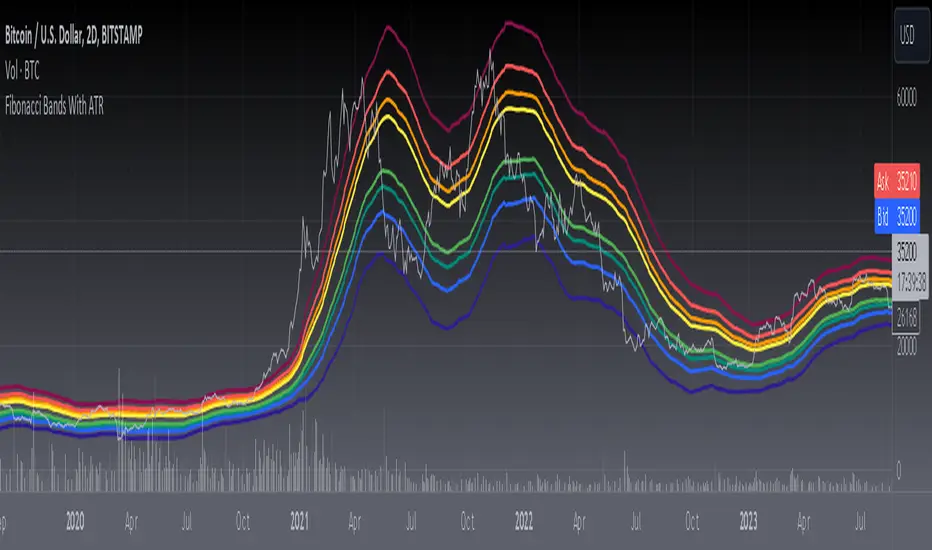
Today, what I'm going to introduce is a technical indicator that I think is quite in line with the indicator displayed by Tang - Fibonacci Bands with ATR. This indicator combines Bollinger Bands and Average True Range (ATR) to provide insights into market volatility and potential price reversals. Sounds complicated, right? Don't worry, I will explain it to you in the simplest way.
First, let's take a look at how Fibonacci Bands are constructed. They are similar to Bollinger Bands and consist of three lines: upper band, middle band (usually a 20-period simple moving average), and lower band. The difference is that Fibonacci Bands use ATR to calculate the distance between the upper and lower bands and the middle band.
Next is a key factor - ATR multiplier. We need to smooth the ATR using Welles Wilder's method. Then, by multiplying the ATR by a Fibonacci multiplier (e.g., 1.618), we get the upper band, called the upper Fibonacci channel. Similarly, multiplying the ATR by another Fibonacci multiplier (e.g., 0.618 or 1.0) gives us the lower band, called the lower Fibonacci channel.
Now, let's see how Fibonacci Bands can help us assess market volatility. When the channel widens, it means that market volatility is high, while a narrow channel indicates low market volatility. This way, we can determine the market's activity level based on the width of the channel.
In addition, when the price touches or crosses the Fibonacci channel, it may indicate a potential price reversal, similar to Bollinger Bands. Therefore, using Fibonacci Bands in trading can help us capture potential buy or sell signals.
In summary, Fibonacci Bands with ATR is an interesting and practical technical indicator that provides information about market volatility and potential price reversals by combining Bollinger Bands and ATR. Remember, make good use of these indicators and apply them flexibly in trading!
This code is a TradingView indicator script used to plot L3 Fibonacci Bands With ATR.
First, the indicator function is used to define the title and short title of the indicator, and whether it should be overlaid on the main chart.
Then, the input function is used to define three input parameters: MA type (maType), MA length (maLength), and data source (src). There are four options for MA type: SMA, EMA, WMA, and HMA. The default values are SMA, 55, and hl2 respectively.
Next, the moving average line is calculated based on the user's selected MA type. If maType is 'SMA', the ta.sma function is called to calculate the simple moving average; if maType is 'EMA', the ta.ema function is called to calculate the exponential moving average; if maType is 'WMA', the ta.wma function is called to calculate the weighted moving average; if maType is 'HMA', the ta.hma function is called to calculate the Hull moving average. The result is then assigned to the variable ma.
Then, the _atr variable is used to calculate the ATR (Average True Range) value using ta.atr, and multiplied by different coefficients to obtain four Fibonacci bias values: fibo_bias4, fibo_bias3, fibo_bias2, and fibo_bias1.
Finally, the prices of the upper and lower four Fibonacci bands are calculated by adding or subtracting the corresponding Fibonacci bias values from the current price, and plotted on the chart using the plot function.
Script open-source
Nello spirito di TradingView, l'autore di questo script lo ha reso open source, in modo che i trader possano esaminarne e verificarne la funzionalità. Complimenti all'autore! Sebbene sia possibile utilizzarlo gratuitamente, ricordiamo che la ripubblicazione del codice è soggetta al nostro Regolamento.
Avoid losing contact!Don't miss out! The first and most important thing to do is to join my Discord chat now! Click here to start your adventure: discord.com/invite/ZTGpQJq 防止失联,请立即行动,加入本猫聊天群: discord.com/invite/ZTGpQJq
Declinazione di responsabilità
Le informazioni e le pubblicazioni non sono intese come, e non costituiscono, consulenza o raccomandazioni finanziarie, di investimento, di trading o di altro tipo fornite o approvate da TradingView. Per ulteriori informazioni, consultare i Termini di utilizzo.