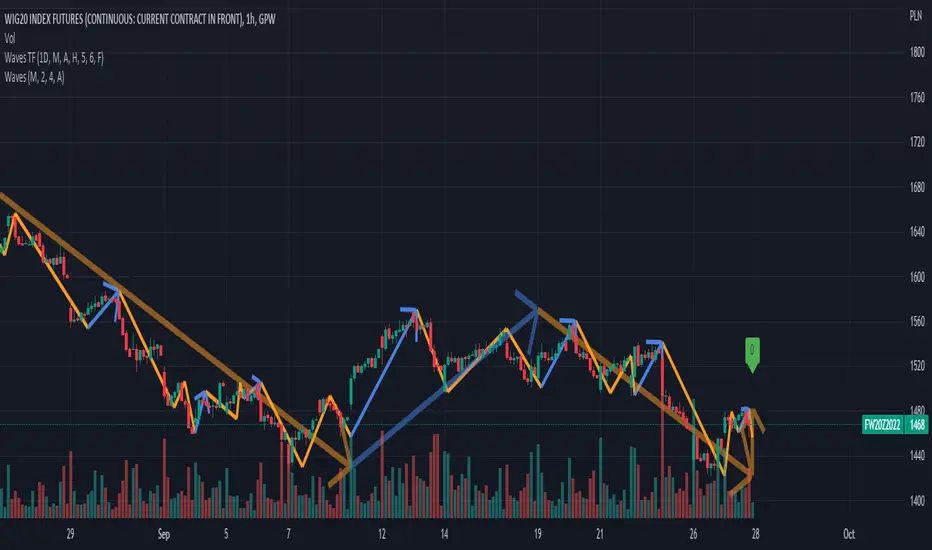
Waves Timeframe

Script settings:
• Timeframe – The interval based on which waves are calculated. Script is working correct only for intervals that are equal or more precise than picked here value. In case of picking lower interval than current, error message will appear.
• Type – Type of waves that are drawn:
o H(ide) – Not drawing any waves
o L(ow) – Drawing low level waves
o M(edium) – Drawing mid level waves
o B(oth) – Drawing both low and mid level waves
• Alfred – Showing extra informations about waves in the context of current candle.
• Wave – How script should visualize wave:
o H(ide) - Not drawing waves.
o S(olid line) – Drawng as solid line
o A (Solid line with Arrow) – Drawing as solid line with arrow
o D(otted line) – Drawing as dotted line.
• Shadow – How script should visualise wave shadows. Waves shadow it's a drawing mode in which wave is draw based on it's extrems instead of moment od detection.
o H(ide) - Do not draw any shadows
o S(olid line) – Draw with a solid line
o A (Solid line with Arrow) – Draw as solid line with arrorw
o D(otted line) – Draw as dotted line
• Low line – Color and line width for low level waves
• Medium line – Color and line width for mid level waves
• Impuls – Color and picking impuls mode:
o H(idden) – Do not show impuls
o F(irst) – Impuls is draw starting from the first wave up
o S(econd) – Impuls jis draw starting from the second wave up
o Auto – The algorithm performs an automatic analysis and selects which of the impulse drawing methods presents impulses with greater price dynamics.
- Fix problem with unconsistent real time data.
- Update trend visualization settings.
Script su invito
Solo gli utenti approvati dall'autore possono accedere a questo script. È necessario richiedere e ottenere l'autorizzazione per utilizzarlo. Tale autorizzazione viene solitamente concessa dopo il pagamento. Per ulteriori dettagli, seguire le istruzioni dell'autore riportate di seguito o contattare direttamente Investor_R.
TradingView NON consiglia di acquistare o utilizzare uno script a meno che non si abbia piena fiducia nel suo autore e se ne comprenda il funzionamento. È inoltre possibile trovare alternative gratuite e open source nei nostri script della community.
Istruzioni dell'autore
More details on Website and Youtube.
Declinazione di responsabilità
Script su invito
Solo gli utenti approvati dall'autore possono accedere a questo script. È necessario richiedere e ottenere l'autorizzazione per utilizzarlo. Tale autorizzazione viene solitamente concessa dopo il pagamento. Per ulteriori dettagli, seguire le istruzioni dell'autore riportate di seguito o contattare direttamente Investor_R.
TradingView NON consiglia di acquistare o utilizzare uno script a meno che non si abbia piena fiducia nel suo autore e se ne comprenda il funzionamento. È inoltre possibile trovare alternative gratuite e open source nei nostri script della community.
Istruzioni dell'autore
More details on Website and Youtube.