PROTECTED SOURCE SCRIPT
Trend vs Range Detector
Markets often oscillate between trend phases and range-bound consolidations. Accurately identifying which environment you're in can dramatically improve your strategy's performance — whether you're a breakout trader, trend follower, or mean reversion specialist.
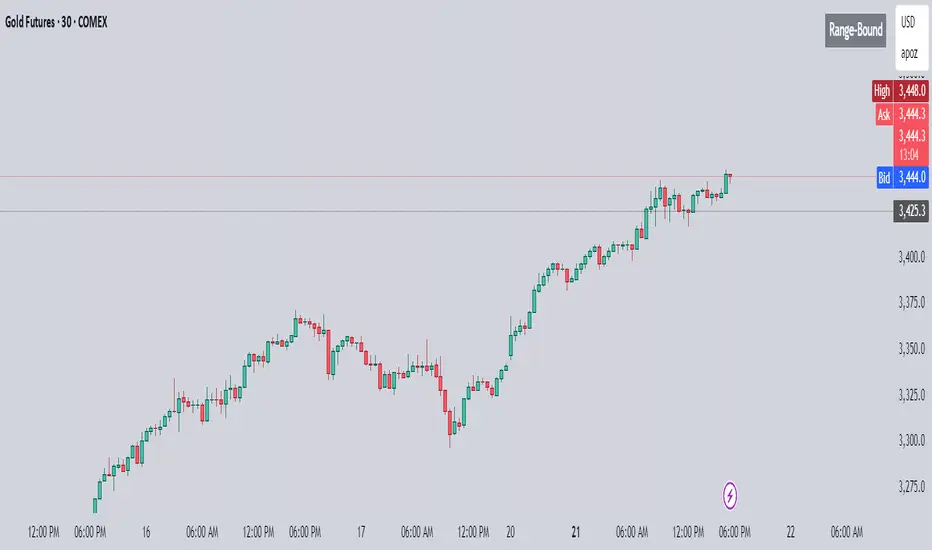
This Pine Script helps do exactly that — with zero clutter, no chart overlays, and a simple, clean table at the top-right corner telling you one thing:
👉 Is the market trending or range-bound?
⚙️ How It Works
The script uses two core metrics to classify the market environment:
1. Slope Sensitivity of Moving Average
A simple moving average (default: 50-period) is used.
The absolute slope of the moving average is calculated.
If the slope exceeds a user-defined sensitivity value, it indicates directional momentum.
2. ATR-to-Price Range Ratio
Measures volatility by comparing Average True Range (ATR) to the total high-low price range over the same period.
A higher ATR relative to the range indicates directional volatility — a trending behavior.
A low ratio signals a choppy or sideways market.
If both conditions are met, the table displays "Trending." If either condition fails, it shows "Range-Bound."
🧠 Why This Matters
Trend Traders: Know when to lean into momentum plays.
Mean Reversion Traders: Avoid whipsaw conditions or capitalize on sideways action.
Volatility Filters: Use this signal to apply different strategies to different market types.
🛠️ User Controls
Moving Average Length: Adjust trend sensitivity by length (default: 50)
Slope Sensitivity: Tune how steep a trend needs to be to qualify
ATR/Range Threshold: Calibrate what defines a volatile enough trend move
Toggle Table On/Off: Keep the chart clean if needed
🧼 Clean Visuals
No lines, no bands, no background colors.
Just a concise table in the top-right corner.
Perfect for scalpers, swing traders, or overlaying on busy strategies.
🔄 Real-Time + Historical
The script dynamically updates with every bar, so it works in real time and shows accurate historical context across any symbol or timeframe.
If you’re someone who wants a minimalist yet powerful insight into market context, this tool can be a game-changer.
Script protetto
Questo script è pubblicato come codice protetto. Tuttavia, è possibile utilizzarle liberamente e senza alcuna limitazione – ulteriori informazioni qui.
Declinazione di responsabilità
Le informazioni e le pubblicazioni non sono intese come, e non costituiscono, consulenza o raccomandazioni finanziarie, di investimento, di trading o di altro tipo fornite o approvate da TradingView. Per ulteriori informazioni, consultare i Termini di utilizzo.