OPEN-SOURCE SCRIPT
RSI Rate of Change (ROC of RSI)

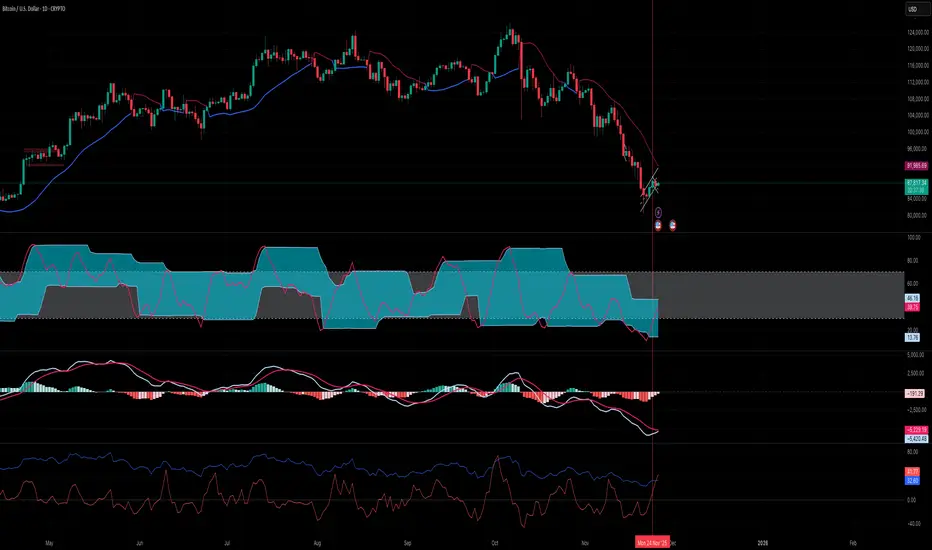
The RSI Rate of Change (ROC of RSI) indicator measures the speed and momentum of changes in the RSI, helping traders identify early trend shifts, strength of price moves, and potential reversals before they appear on the standard RSI.
While RSI shows overbought and oversold conditions, the ROC of RSI reveals how fast RSI itself is rising or falling, offering a deeper view of market momentum.
How the Indicator Works
1. RSI Calculation
The indicator first calculates the classic Relative Strength Index (RSI) using the selected length (default 14). This measures the strength of recent price movements.
2. Rate of Change (ROC) of RSI
Next, it computes the Rate of Change (ROC) of the RSI over a user-defined period.
This shows:
Positive ROC → RSI increasing quickly → strong bullish momentum
Negative ROC → RSI decreasing quickly → strong bearish momentum
ROC crossing above/below 0 → potential early trend shift
What You See on the Chart
Blue Line: RSI
Red Line: ROC of RSI
Grey dotted Zero Line: Momentum reference
Why Traders Use It
The RSI ROC helps you:
Detect momentum reversals early
Spot bullish and bearish accelerations not visible on RSI alone
Identify exhaustion points before RSI reaches extremes
Improve entry/exit precision in trend and swing trading
Validate price breakouts or breakdowns with momentum confirmation
Best For
Swing traders
Momentum traders
Reversal traders
Trend-following systems needing early confirmation signals
Script open-source
Nello spirito di TradingView, l'autore di questo script lo ha reso open source, in modo che i trader possano esaminarne e verificarne la funzionalità. Complimenti all'autore! Sebbene sia possibile utilizzarlo gratuitamente, ricordiamo che la ripubblicazione del codice è soggetta al nostro Regolamento.
Declinazione di responsabilità
Le informazioni e le pubblicazioni non sono intese come, e non costituiscono, consulenza o raccomandazioni finanziarie, di investimento, di trading o di altro tipo fornite o approvate da TradingView. Per ulteriori informazioni, consultare i Termini di utilizzo.