OPEN-SOURCE SCRIPT
Previous Hour High and Low
### **🔷 Previous Hour High & Low Indicator – Description**
#### 📌 **Overview**
The **Previous Hour High & Low Indicator** is designed to help traders identify key levels from the last completed hourly candle. These levels often act as **support and resistance zones**, helping traders make informed decisions about potential breakouts, reversals, and liquidity grabs.
#### 🎯 **How It Works**
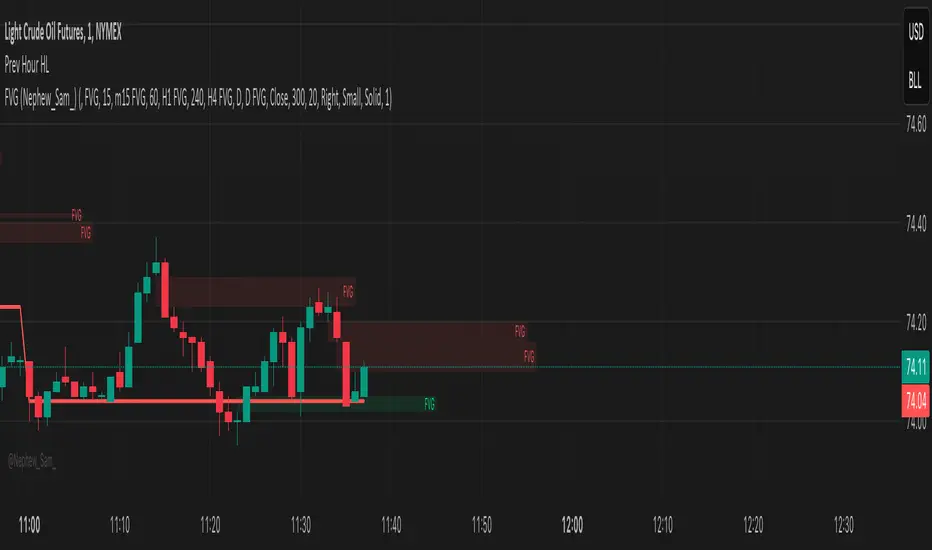
- At the start of every new hour, the indicator **locks in** the **high and low** from the **previous fully completed hour**.
- It then **draws horizontal lines** on the chart, marking these levels.
- Works **only on intraday timeframes** (e.g., 1m, 5m, 15m, 30m), ensuring clean and relevant levels.
- Updates dynamically **every new hour** without repainting.
#### 🔑 **Why Is This Useful?**
✔ **Identifies Key Liquidity Zones** – The market often reacts to previous hour highs/lows, making them useful for stop hunts, liquidity grabs, and order block setups.
✔ **Works Well with ICT Concepts** – If you're trading **ICT kill zones**, these levels can help in finding optimal trade entries.
✔ **Helps with Breakout & Rejection Setups** – Traders can watch for price breaking or rejecting these levels for trade confirmation.
✔ **Useful for Scalping & Day Trading** – Works best for short-term traders looking for intraday movements.
#### ⚙ **Customization Options**
- The high and low levels are color-coded:
🔵 **Previous Hour High (Blue)** → Acts as potential resistance or breakout point.
🔴 **Previous Hour Low (Red)** → Acts as potential support or breakdown level.
#### 📊 **Best Timeframes to Use This On**
- **1-minute, 5-minute, 15-minute, 30-minute charts** → Most effective for intraday trading.
- Avoid using on **hourly or higher timeframes**, as these levels become less relevant.
---
🚀 **This indicator is perfect for traders looking to track short-term price reactions at key levels.** Let me know if you want to add alerts, zone shading, or any other enhancements! 🔥
#### 📌 **Overview**
The **Previous Hour High & Low Indicator** is designed to help traders identify key levels from the last completed hourly candle. These levels often act as **support and resistance zones**, helping traders make informed decisions about potential breakouts, reversals, and liquidity grabs.
#### 🎯 **How It Works**
- At the start of every new hour, the indicator **locks in** the **high and low** from the **previous fully completed hour**.
- It then **draws horizontal lines** on the chart, marking these levels.
- Works **only on intraday timeframes** (e.g., 1m, 5m, 15m, 30m), ensuring clean and relevant levels.
- Updates dynamically **every new hour** without repainting.
#### 🔑 **Why Is This Useful?**
✔ **Identifies Key Liquidity Zones** – The market often reacts to previous hour highs/lows, making them useful for stop hunts, liquidity grabs, and order block setups.
✔ **Works Well with ICT Concepts** – If you're trading **ICT kill zones**, these levels can help in finding optimal trade entries.
✔ **Helps with Breakout & Rejection Setups** – Traders can watch for price breaking or rejecting these levels for trade confirmation.
✔ **Useful for Scalping & Day Trading** – Works best for short-term traders looking for intraday movements.
#### ⚙ **Customization Options**
- The high and low levels are color-coded:
🔵 **Previous Hour High (Blue)** → Acts as potential resistance or breakout point.
🔴 **Previous Hour Low (Red)** → Acts as potential support or breakdown level.
#### 📊 **Best Timeframes to Use This On**
- **1-minute, 5-minute, 15-minute, 30-minute charts** → Most effective for intraday trading.
- Avoid using on **hourly or higher timeframes**, as these levels become less relevant.
---
🚀 **This indicator is perfect for traders looking to track short-term price reactions at key levels.** Let me know if you want to add alerts, zone shading, or any other enhancements! 🔥
Script open-source
Nello spirito di TradingView, l'autore di questo script lo ha reso open source, in modo che i trader possano esaminarne e verificarne la funzionalità. Complimenti all'autore! Sebbene sia possibile utilizzarlo gratuitamente, ricordiamo che la ripubblicazione del codice è soggetta al nostro Regolamento.
Declinazione di responsabilità
Le informazioni e le pubblicazioni non sono intese come, e non costituiscono, consulenza o raccomandazioni finanziarie, di investimento, di trading o di altro tipo fornite o approvate da TradingView. Per ulteriori informazioni, consultare i Termini di utilizzo.