Timeless Command | QuantEdgeB
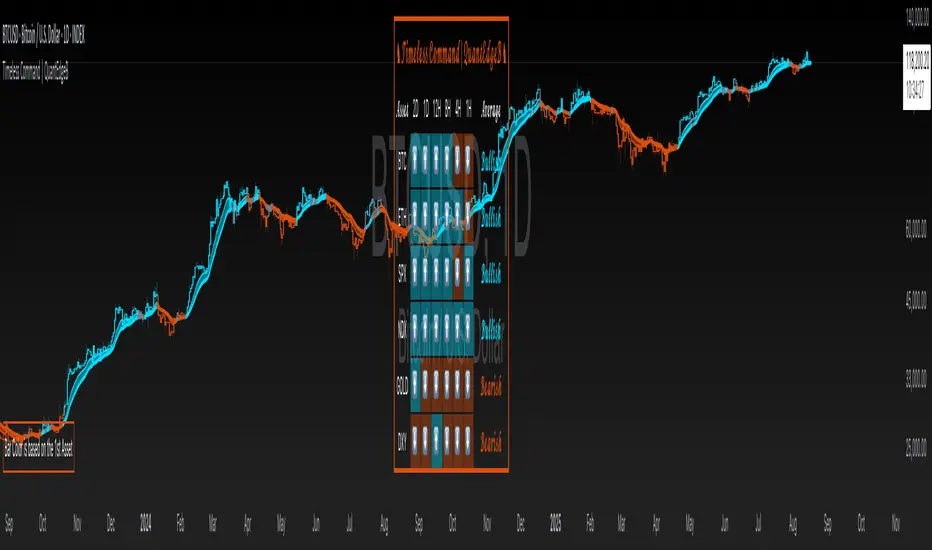
Timeless Command is a multi-asset, multi-timeframe “sentiment dashboard” built around a custom Universal Strategy. It fuses two independent proprietary oscillators into one normalized signal, then snapshots that signal across six user-chosen assets and six user-chosen timeframes—right on your price chart. You instantly see whether Bitcoin, Ethereum, Gold, the U.S. Dollar Index, the S&P 500 or the Nasdaq are “Bullish” or “Bearish” from the 2-day down to the 15-minute horizon, plus an overall bias and bar-color overlays.
✨ Key Features
• 🧠 Universal Strategy
o Combines two independent strategic modules into a single oscillator.
o Applies upper/lower thresholds to generate Long/Short/Neutral signals.
• 🌐 Multi-Asset, Multi-TF Grid
o Up to six symbols (e.g. BTC, ETH, SPX, NDX, GOLD, DXY).
o Six configurable timeframes (days, hours, minutes).
o Automatic conversion of “4H” → “240” minutes for seamless request.security calls.
• 📊 Live Sentiment Table
o Arrow icons per asset/timeframe (“⬆️” vs “⬇️”).
o Per-asset average bias (“Bullish” / “Bearish” / “Neutral”), color-coded.
o Clean, right-aligned table overlay with asset labels and timeframe headers.
• 🎨 Chart Overlays
o Bar coloring driven by the first asset’s average TPI bias.
o Two EMAs (default 12/21) filled to show trend direction.
o Optional mini info table to explain bar-color logic.
⚙️ How It Works
1. Signal Calculation
o Applies thresholds (±0.1) to yield discrete signals from a Universal Strategy: +1 (long), –1 (short), 0 (neutral).
2. Multi-TF Signal Gathering
o For each asset, the script uses request.security to pull the TPI on each selected timeframe, locking values at bar close for consistency.
o Converts each reading into a binary direction (up/down).
3. Averaging & Labeling
o Averages the six directional values per asset to gauge overall bias.
o Renders a “Bullish” or “Bearish” label (or “Neutral” if exactly zero).
4. Visual Overlay
o Bar Color: The chart’s candles recolor based on the first asset’s average bias—blue for bullish, orange for bearish, gray for neutral.
o EMAs: Two exponential moving averages sweep the chart, filled to highlight trending regimes.
5. Dashboard Table
o Rows = assets, columns = timeframes + “Average” column.
o Each cell shows an arrow icon with background shading.
o Last column spells out the per-asset average bias in styled text and color.
🎯 Who Should Use It
• Macro Traders who want a quick cross-market heatmap.
• Multi-Asset Strategists balancing exposure across crypto, equities, FX and commodities.
• Systematic & Discretionary players looking for unified, threshold-based signals.
• Risk Managers needing a real-time sentinel on regime shifts across key markets.
⚙️ Default Settings
• Assets: BTCUSD, ETHUSD, SPX, NDX, GOLD, DXY
• Timeframes: 2D, 1D, 12H, 4H, 1H, 15m
• Thresholds: ±0.1 for long/short entries
📌 Conclusion
With Timeless Command, you gain an at-a-glance “command center” for cross-market sentiment. It turns complex, multi-TF oscillator data into a simple arrow-and-table view, coloring your price bars to reinforce the prevailing bias. Whether you’re hunting trend continuations, regime changes or mean-reversion setups, this overlay gives you the high-level context you need—without digging through six different charts.
🔹 Disclaimer: Past performance is not indicative of future results. No trading strategy can guarantee success in financial markets.
🔹 Strategic Advice: Always backtest, optimize, and align parameters with your trading objectives and risk tolerance before live trading.
Script su invito
Solo gli utenti approvati dall'autore possono accedere a questo script. È necessario richiedere e ottenere l'autorizzazione per utilizzarlo. Tale autorizzazione viene solitamente concessa dopo il pagamento. Per ulteriori dettagli, seguire le istruzioni dell'autore riportate di seguito o contattare direttamente QuantEdgeB.
TradingView NON consiglia di acquistare o utilizzare uno script a meno che non si abbia piena fiducia nel suo autore e se ne comprenda il funzionamento. È inoltre possibile trovare alternative gratuite e open source nei nostri script della community.
Istruzioni dell'autore
whop.com/basetrustcapital 💎
🔹 Unlock our free toolbox:
tradinglibrary.carrd.co/ 🛠️
Disclaimer: All resources and indicators provided are for educational purposes only
Declinazione di responsabilità
Script su invito
Solo gli utenti approvati dall'autore possono accedere a questo script. È necessario richiedere e ottenere l'autorizzazione per utilizzarlo. Tale autorizzazione viene solitamente concessa dopo il pagamento. Per ulteriori dettagli, seguire le istruzioni dell'autore riportate di seguito o contattare direttamente QuantEdgeB.
TradingView NON consiglia di acquistare o utilizzare uno script a meno che non si abbia piena fiducia nel suo autore e se ne comprenda il funzionamento. È inoltre possibile trovare alternative gratuite e open source nei nostri script della community.
Istruzioni dell'autore
whop.com/basetrustcapital 💎
🔹 Unlock our free toolbox:
tradinglibrary.carrd.co/ 🛠️
Disclaimer: All resources and indicators provided are for educational purposes only